
Faheem (@FaheemH) from Denmark sent me this beautiful infographic depicting various facts about Immigrants in Denmark.
Immigrants in Denmark – Excel Infographic:
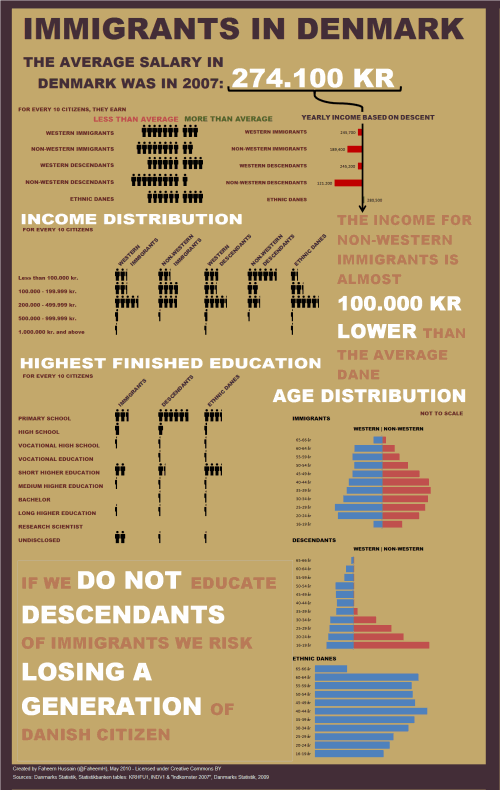
How is this Info-graphic made?
Faheem used a variety of tricks to create this infographic. Some of the key ideas are,
- Using text boxes and drawing shapes
- Using bar charts (with both negative and positive values)
- Using images (the stick figure charts are actually images)
- Using text, fill color and borders effectively to create the canvas
Download the Source File
Click here to download the source file of this infographic and play with it.
Thank you Faheem
Thank you so much for sharing your awesome work with all of us Faheem. You are a true champ. 🙂
Send your tips / downloads for Reader Awesomeness Week:
You too can participate and share what you know by simply filling up online form. Go on, be awesome. (details here)


8 Responses
Good work Indeed !!
Thanks Faheem for sharing such ideas :o)
Wonderful choice of colours. How did you space out all the “people” and get half “people”?
The choice of colors was taken from an infographic about Obama and 350 years history of african americans.
The people are simply a .png image, adapted from the Creative Commons BY logo, that i’ve inserted and spaced out manually. Once you have the spacing of two in place, copy paste that and repeat.
To get the half people, i had to right click each of the figures, and then properties and use crop from left with percentages.
However, when cropping from the side, you cannot crop there’s a limit to how small your intial image is allowed to become. So, all of my cropped men are half, instead of 1/6 or 1/4.
As for the text. In Excel it’s not possible to have multisized, multicolored in a cell, so that had to be inserted via a text-box. Because i never thought about using text-boxes for text (duh!) i wrote some text on a different sheet, and copied it as a picture.
The graph in the upper right, with the arrow, is a overlayed bar chart and the arrow is simply a shape.
Like the idea, but why didn’t you make the people image dynamic?
For Bar charts, you can chose a picture to fill the bar. with an overlap of white, you can show the chart increasing or decreasing.
I’ve done an example but I don’t know how to upload my example,
p.s. you can change text and colour in cells. I’m using 2003 so this should be available to all. I would say that I haven’t been able to change size and colour with formula though!
This is a wonderful InfoGraphic…. Can any one create a inforgraphic resume identical to Immigrants in Denmark.. Check out the link below: http://theportfolio.ofmichaelanderson.com/wp-content/uploads/2008/05/resume-infographic.jpg
Quick question–this infographic looks great, but why would you opt to use excel versus illustrator? It would take 10x longer to make this in excel, so in terms of ROI it doesn’t seem like using excel is worth it for the amount of time spent having to manipulate a database program to function like a vector-based program.