
This is a guest post by Myles Arnott from Clarity Consultancy Services – UK.
- Part 1: Introduction & overview
- Part 2: Dynamic Charts
- Part 3: VBA behind the Dynamic Dashboard a simple example
- Part 4: Pulling it all together
Part 1 of dynamic dashboard tutorial introduced the purpose and general functionality of the model. In this post we are going to look at the first 4 charts and see how they work.
Chart 1 and Chart 2 : Flexible pie charts
These are Dynamic pie charts with the option to select the KPI, period and product/salesperson to be analyzed. As both pie charts use the same functionality I will focus on the chart in CH1.
The key to the flexibility of these otherwise simple pie charts is taking a little time to set up the chart source data.
1) Selection criteria
We want to be able to select data by product group and month and be able to choose the key performance indicator to report. We also want to be able to report on all product groups and for all periods.
To ensure that only valid criteria are selected, each selection is driven from a data validation list driven from a named range:
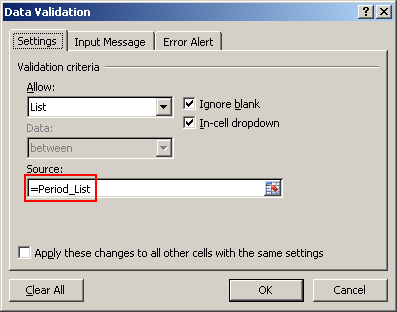
2) The formula
The main formula being used is the SUMIFS(Sum range, Criteria range, criteria,…). This was a new formula in 2007 and provides a simpler solution to the SUMPRODUCT() formula.
So the formula in cell D24 in CH1 is:
=SUMIFS(INDIRECT($C$21),Sales_Per,B24,Product,$C$19,Period,$C$20)
Right, lets break it down for you:
Sum range
To create flexibility around the values returned I have used the INDIRECT formula to reference a named range. The named ranges are Count, Total_sales KPI_1 and Total_GP. I have then referenced these three named ranges within the data validation list.
Criteria range 1 and criteria 1
This matches the sales person in B24 against the list of sales people (named range Sales_Per) in the data tab.
Criteria range 2 and criteria 2
This matches the product in C19 against the list of products (named range Product) in the data tab.
Criteria range 3 and criteria 3
This matches the period in C20 against the list of periods (named range Period) in the data tab.
The result of bringing all of this together is that the value returned is:
- The value range as defined in C21
- The sales person as defined in B24
- The product as defined in C19
- The period as defined in C20
3) The final step – Dealing with “All”
The final element to enable the fully flexibility is to allow “all” to be selected for product and period. This gives you four options:
- Product and period specified
- Product specified, all periods
- All products, period specified
- All products and all periods
To manage this I have created a column for each option with a variation of the formula defined above. Finally I used a column as source data for the chart which pulls though the relevant information based on the selections made. They look like this:

I leave the interpretation of the actual formulas to you.
CH3 and CH4 Flexible line charts

These are dynamic line charts with the option to select the KPI, period and product/salesperson to be analyzed. As both line charts use the same functionality I will focus on the chart in CH3.
1) Selection criteria
This uses the same functionality as used in the pie chart illustration.
2) The formula
Once again the basic formula is the same as in the pie chart illustration.
The additional step is to allow flexibility around the period to display for the trend. This is achieved by selecting a period from a validation list. The following periods are then looked up from the validation list using HLOOKUP and MATCH. First take a look at how it works:

Now the formula is:
=HLOOKUP("YTD",Period_List,MATCH($C$23,Period_List2,0)+2,FALSE)
How this formula works?
C23 contains the first cell from which starting month can be changed. Based on that, we need to increment the month value for subsequent columns by 1, 2 and 3. The above is the formula for first such month. If you look at the downloaded file carefully, you will know why this works. 🙂
3) The final step – Dealing with “All”
As with the pie charts illustration the final step is to enable the user to select all. As the functionality as very similar to that used in the pie charts I will allow you to work through how it works.
Creating other Dynamic Charts in the Dashboard:
Links for how to create the other charts in this report can be found below:
- Boxcharts [Link]
- Scrolling report [Link]
- Competitor analysis [Link]
- Use of camera tool [Link]
- In cell microcharts [Link]
What Next?
We now know how to create the charts for the Dynamic Dashboard. Next week we will look at Part 3 VBA behind the Dynamic Dashboard, by studying a simple example.
Download the complete dashboard
Go ahead and download the dashboard excel file. The dynamic dashboard can be downloaded here [mirror, ZIP Version]
It works on Excel 2007 and above. You need to enable macros and links to make it work.
Added by PHD:
Myles has taken various important concepts like Microcharts, form controls, macros, camera snapshot, formulas etc and combined all these to create a truly outstanding dashboard. I am honored to feature his ideas and implementation here on PHD. I have learned several valuable tricks while exploring his dashboard. I am sure you would too.
If you like this tutorial please say thanks to Myles.
Related Material & Resources
- Excel Dynamic Charts – Tutorials, Examples and Demos
- Excel Dashboards – Tutorials & Templates Section of PHD
- 6 Part Tutorial on Making KPI Dashboards in Excel
This is a guest post by Myles Arnott from Clarity Consultancy Services – UK.


10 Responses
Hi Myles and Chandoo
very interesting dashboard, and presentation technique. I have got loads of good ideas for my coming models.
All the graphs are known stuff if you have followed Chandoos homepage or some of the other well known Excel graph home pages.
I have not been aware of the Help file created by John Walkenbach, which I find very usefull.
But the most interesting part of the presentation is the Dynamic Dashboard with the flexibility of changing graphs and presentations.
As you have not yet shown how this part is working, it could be very interesting if you could show a version where we can put the place on a graph (the other way of how your model is working as well.
best regards
Jørgen
Hi,
How to reset the count function in excel macro?
Dear:
which means the letter “A”, “G” and “R” on sheet CH5
Pie charts are really underrated. But you did it well chandoo.
a well equipped dynamic pie chart is far better than using lots of static charts.
I not anderstant this is formula numarikal control this is hard
Is there any vedio for this it would be a great help for us. Rest are awesome theory
Hi Chandoo,
Amazing work for the community. I really appreciate the same.
The download link to the entire dashboard doesn’t work for me.
Below is the link that am referring to:
http://cid-b663e096d6c08c74.skydrive.live.com/self.aspx/Public/dynamic-dashboard/Dynamic%20Dashboard%20Illustration%20V1.1.xlsm
Hi Chandoo,
I attempted to download the workbooks associated with the Making Dynamic Dashboards in Excel, but there seems to be a broken link to the OneDrive file location. Can you please fix this so I can download the sample files?
Cheers,
Mark P.
MN USA