
It is the customer on the phone again, she wants to know what products we have.
How cool would it be if we can send her a spreadsheet with all the products neatly listed in a table and she can use filters to find what she likes. Alas, we end up sending a biggish PDF brochure that is both difficult to make and maintain.
Well, not any more.
Today we will learn a very useful and fun trick in Excel. We will create a product catalog using Excel that you can send to your clients or boss (and impress them).
We will create something like this:
Step one: Set up the product catalog in Excel Spreadsheet
This is a simple step. Define a table structure for your product catalog. For our example – Supurr Market, I have chosen only one column, with the images of various Cats the shop sells. But you can add more columns like size, age, price, features etc.
- Now, adjust row heights / column widths in such a way that you can fit in the images in cells.
- And align images of your products neatly in the cells.
- Also, just type the product name in the cells where you have kept the images.
Step two: Adjust image properties so that they can be filtered
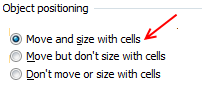 We will finish this step before you can snap your fingers. Just select all the images, right click and select Format picture (in Excel 2007, you need to select ‘size & properties’) and go to “properties” tab. Here change the option to “Move and size with cells” from whatever it is earlier.
Step three: Apply data filters so that your product catalog can be filtered
Do that.
Step four: Time to impress your clients
Send the lean and sleek product catalog to your clients. Tell your story elegantly and get some orders.
Download the product catalog template workbook
Click here to download the excel product catalog workbook. Use it to learn and make your own product catalogs using MS excel.
Do you run a small business? Tell me how you use excel.
I think Excel has great potential to manage 90% of small business IT operations. It is simple to learn and easy to maintain. I want to know how you use excel to manage your small business. Share your experiences and ideas using comments.
Learn how you can do the same for charts: Dynamic Charts in Excel
PS: Special thanks to Gerald Higgins for telling me about the image properties tip.


19 Responses
Great idea. Here’s another idea…you could use Excel’s group and outline functionality. That way, you can have nested catalogues.
My reworked example at http://cid-f380a394764ef31f.skydrive.live.com/self.aspx/.Public/product-catalog-using-excel-grouping.xls
@Jeff… that is even more impressive… thanks for the little surpise hidden in the sheet too 🙂
I recently subscribed to the RSS feed for Pointy Haired Dilbert, and like what I’ve seen so far. Thanks for what you do!
In Jeff’s reworked example, how do you get the, for lack of a better word, frame on the left side of the sheet with the collapsed rows? It has columns 1, 2 & 3.
Nice but if You have a lot images that can take long time.
Hi, I have 400 images. I normally use excel- but this time 400 images is jst a bit too much for doing it with excel. Is there a way excel can add the file name automatically next to the images? It can save me a lot of time- really a lot of ime!!
Please help…
@Raghav Malani
Insert hundreds file names & images within one minute…
Search on web “Excel Image Assistant” This add in for Excel and can do it.
Regards
hey how do I like export the thing, like I’m 14 and I’m doing this for my mum’s buisness, so in the image above you have of what it will look like, how do I get it to do that ?
@Brittany
Export what thing and into what format ?
Hey Chandoo,
How do you get the drop down list to look as it does on this webpage?
I can only get it to be the normal drop down filter where you have to tick (and un-tick) what you want…
Yours looks much more professional.
Thank you for the catalog filter. However, I am having a problem. I am trying to mail merge only the filtered (i.e. visible) catalog item records into Word 2011 but it merges all the items, including the hidden records. Is there a way to automatically copy the filtered records to a designated worksheet (that always gets erased prior to the new data being pasted) within the same Excel workbook each time the filter is applied? I would like this to happen in the background so that I can remain in the Excel Product Catalog worksheet once the macro is completed.
Is there a catalog sample for brake rotors?
not able to download the file. websense does not allow it. Pls host the file in your own website.
Take advantage of the automation available from http://doality.com
Great post! We are linking to this great content on our site.
Keep up the great writing.
not able to download the product catalog template. please help
Nothing there
Can you check again please. I fixed the link now.