This series of articles will give you an overview of how to manage spreadsheet risk. These articles are written by Myles Arnott from Excel Audit
- Part 1: An Introduction to managing spreadsheet risk
- Part 2: How companies can manage their spreadsheet risk
- Part 3: Excel’s auditing functions
- Part 4: Using external software packages to manage your spreadsheet risk
In the first two articles in this series we highlighted the risks that poorly managed spreadsheet solutions can introduce to a business and outlined the steps companies can take to manage this risk. This article works through the application of some of Excel’s built in auditing functions:
- Error checking (Background and stepping through each error)
- Trace Error
- Circular Reference
- Go To Special
Let’s have a look at an example spreadsheet that is riddled with issues.
The spreadsheet contains four tabs: a simple front page; an Example tab with the report that we wish to audit; a Resolved tab with the corrected report; and a Notes tab which details all of the issues contained within the spreadsheet (if you print the Resolved tab, all of the comments will also be printed for your reference).
If you are up for a challenge you could download the file and work through the report in the Example tab to see how many of the errors you can find yourself.
First off let’s identify the obvious issues
Circular reference
On opening the file you are presented with this warning message:

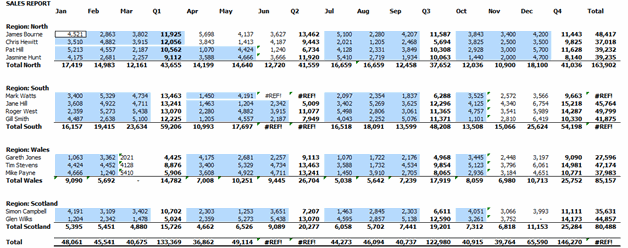
Click OK to continue opening the file. Here is how the report looks:
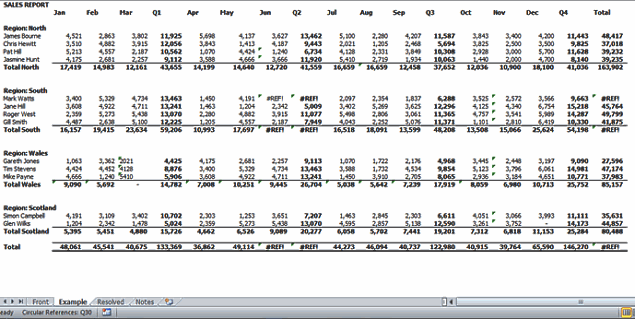
Excel helpfully gives you the location of the first circular reference (Q30) in the bottom left corner of the screen:

An alternative approach to locating circular references is to select Error Checking > Circular References on the Formulas tab of the Ribbon:

By clicking into the formula on cell Q30 you will see that the formula is =AVERAGE(M30:N30,P30:Q30). This average formula is including the cell Q30, hence the circular reference.
[Related: Understanding & Using Excel Circular References]
#REF error
The next obvious issue is that cells I13, J13, J33, S13, S18 & S33 contain the #REF error. The #REF error is a warning that the formula contains an invalid cell reference (this usually happens when the user deletes a cell/row/column/worksheet that is being referenced by a formula).
To trace the cell originating this error select any cell containing the error (I chose S33 as this would appear to be the main report total), and select Error Checking > Trace Error on the Formulas tab of the Ribbon:

This highlights that cell I13 is the source of the error:

Cell I13 contains the formula =3109+#REF!. To remove the error simply remove the +#REF! within the formula.
It is also however important to try to understand what cell was referenced by the formula originally. The best way to do this would be to talk to the user/previous user (if they are still there) and look back through archived versions of the report (if they exist).
Now that the obvious issues have been identified we are now going to employ some of Excel’s other auditing tools to see if there are any hidden errors.
[Related: Understanding & fixing Excel Formula Errors]
Excel’s error checking function
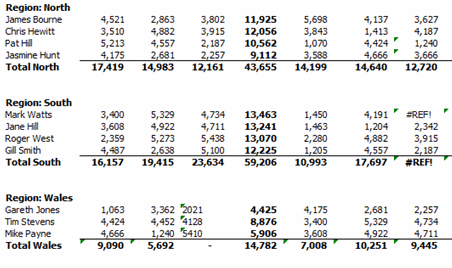
I’m sure that you will have noticed the small green triangles in the top left hand corner of some of the cells. This is Excel’s background error checking function warning you that these cells break one of the predetermined rules.
Firstly let’s have a look at the errors that are being checked for. To open the Error Checking options select File > Options> Formulas (2010) or Office button> Excel options>Formulas (2007).
Below is the default set up:
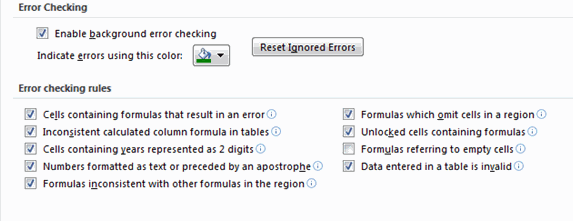
When reviewing a spreadsheet for errors it is always worth a quick check to ensure that the above is set up as you would like it to be. I always also tick the “Formulas referring to empty cells” rule.
Click OK to return to the spreadsheet.
The most systematic way to walk through all of the issues identified by the error checking function is to run Error Checking on the Formulas tab of the Ribbon:

This launches the Error checking dialogue box and allows you to review each error in turn:
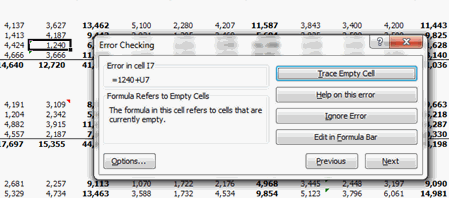
I will leave you to run through the errors one by one to see what Excel picks up.
Please note that this is not a fool proof check as it is simply checking against the predefined rules. This function will not highlight cells that comply with the rules but contain other errors. It can also highlight cells as an error when they are not (eg P13, in this case click on “Ignore Error”). A very useful starting point nonetheless.
Reviewing the report structure
A crucial step to ensuring that a spreadsheet is error free is to understand its structure, and then to ensure that this structure is correct and consistent.
The simplest way to do this is to identify the different types of cells and their relative positions within the worksheet. For this simple example we are looking to identify:
- Input cells (Numbers)
- Input cells (Text)
- Formula cells
- Formula cells returning an error
To achieve this quickly and simply I have built a basic macro which is within the spreadsheet and can be run from the “RUN” button in the Example tab.
This colors each cell type as follows:

This very quickly identifies some structural issues in the spreadsheet:
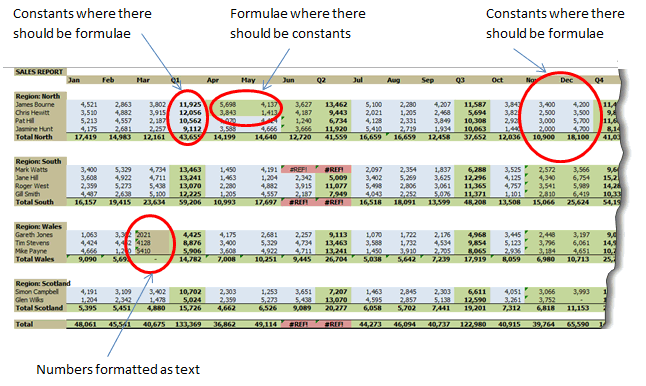
So how does this work?
The macro above uses Excel’s Go To Special function which helps you to quickly select cells of different types.
To launch Go To Special, click on Find and Select> Go To Special on the Home tab of the Ribbon:
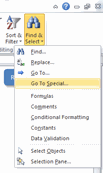
(Alternatively press F5 or Ctrl + G to launch the Go To dialogue box and then click on Special…)
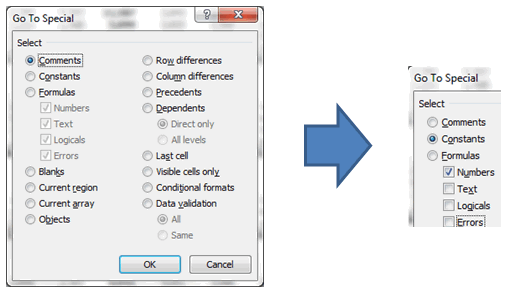
For example, selecting Constants and leaving just Numbers ticked will highlight all numbers on the current worksheet:
It is worth playing with the options on Go To Special as there are some great functions that I sadly don’t have time to cover here (the precedents, Dependents and Row/Column differences functions are particularly useful).
[Related: More uses of Go To Special in Excel]
And Finally…
As valuable as these initial tests are there are still some issues in the spreadsheet that only a detailed investigation will highlight.
So I’ll leave you to grab a coffee and see if you can find them (they are covered in the Notes and in the Resolved tab).
In the final article of the series we will have a quick look at an example of spreadsheet auditing software.
Also, we are planning to write an article explaining other useful features of Go To Special dialog.
What about you?
Do you use Spreadsheet auditing functions? What is your experience with them? What are your favorite features? Please share using comments.
Thank you Myles
Many thanks to Myles for writing this series. Your experience in this area is invaluable. If you enjoy this series, drop a note of thanks to Myles thru comments. You can also reach him at Excel Audit or his linkedin profile.


24 Responses to “10 Supercool UI Improvements in Excel 2010”
The best improvement by far is the Collapse Ribbon ^ button !
Kind of a shame that some of the best improvements are actually returns to old functionality. One thing I don't like is that to get to recent files I need to do an extra click after File - apart from Save As, that's why I'm usually in the File menu. I like the sparkline options, though they are still as not fully featured as some of the free and pay options out there.
The collapse button for the ribbon menu is good news. Can you make the ribbon menus stick too?
Nine improvements, not ten. You can also select multiple objects in 2007. Click on the Find & Select item at the far right of the Home tab, and the dropdown looks remarkably like your 2010 screenshot.
@Jon.. Thank you. Dumb me, I somehow thought we couldnt select objects in Excel 2007. Just saw the "select menu" and it is there. I have corrected the post and removed the point. I have added the "you can make your own ribbons" instead. Thanks once again.
@Arti: what do you mean by make ribbons stick?
@Alex: May be it is my installation, but when I go to "File menu" I see "recent files" by default.
For example, if I am working with one of the contextual ribbon menus (Pivot tables, Drawing/Chart etc), as soon as I click away from the selected object, the menu tabs vanish. If I click on the object again immediately, then Excel will remember what I was looking at, but if I wander away and click on a Pivot, then back again on the Chart, the menus will 'appear' but not get activated, thereby causing much annoyance and additional clicking.
I want to "pin" the whole menu (not invididual commands) somehow, so that I can have the menu there for the length of the time I am working with graphics. Excel 2003 used to have the Drawing toolbar you could detach and hover while you were working, but this functionality disappeared in Excel 2007.
My thought was Excel should just allow a 'pin', similar to the Recently Opened files menu, for the Ribbon Menus as well. If I have not selected any Drawing object, the commands can be greyed out, but I want the menu as a whole to 'stick'.
@Arti... I think MS solved this problem differently. When I select a pivot and go to "design" tab Excel 2010 remembers this and automatically takes me to "design" tab when I reselect the pivot.
Apart from this you can also define your own ribbon with all the things you normally do. See the above article (I have added this after Jon's comments)
Nice feature. About time for a upgrade for MS Office
Oh... okay. That might be a start. I'd probably just copy-paste the Drawing tab haha. Thanks. I'll definitely give Excel 2010 a try.
Btw - have you considered getting into / gotten into the world of Excel as it meets SharePoint?
Actually, the replacement new thing is probably better than all the rest. One thing that the designers of the Office 2007 ignored was allowing regular users to customize their own interface. Office 2010's interface was expanded in this way to address the huge uproar.
Is there still a limit on how many things you can add to the QAT bar? (I'm too lazy to look myself.)
@Jeff.. it seems to take quite a few, but only shows one line and gives a little arrow button at the end. (summary: shucks!)
The best thing is you can edit the ribbon directly from excel, so now i can create my own bar with just the things I use regularly!
One of the annoying things in 07 for me is the Add-Ins menu bar - in 03 I could keystroke directly to menu add ins.. In 07 I needed an extra keystroke just to activate the add-in menu, then the keystrokes as normal.. Hope this marek sense..
John -
If you remember the old Excel 2003 Alt-key shortcuts, you can still use them in 2007. To get to the Add-In dialog:
Alt-T-I
Dear Arti & Chandoo
Seen your comments over some issues. Hope you are form India, gone through your comment expecting a pin to command it as a whole, great, hope if someone out of MS have read it, it may be kept in mind while the next R & D of Office Ver. 16
Just incase someone forgot CTRL+F1 will collapse the ribbon.
[...] was pleasantly surprised when I ran Microsoft Excel 2010 for first time. It felt smooth, fast, responsive and looked great on my [...]
I like the sparklines, and the ability to modify the charts
How do you get rid of the advertisment on the right hand side? If you upgrade then will it take off the ads?
Once again Microsoft has re-decorated the Office and we are NOT pleased!
The graphics object selector can be found in the Home ribbon under Find & Select, Select Objects near the bottom of the drop down. You can make it part of the Quick Access toolbar by right click over it and selecting Add to Quick Access toolbar.
The graphics "cursor" will now appear on the mini-toolbar at the top left of the window.
How to get rid of "Add-Ins" button in Backstage (File)" menu by means of XML code, i.e. to hide, to delete or to disable this button?
This button is usually situated in the Backstage menu between "Help" and "Options" buttons.
Vladimir, did you ever get an answer to your question?
I am tying to customize the ribbon UI for a file using XML, and this is precisely the piece I can't figure out. I can hide other tabs, remove items from QAT and backstage - all except the options that are showing up under add-ins in backstage. If there is an XML syntax for referencing this thing and making it invisible, I cannot find it.
Hey, nice tutorial. Please check my video tutorial on similar topic at the below link and provide your comments:
http://www.youtube.com/watch?v=TeIFc0jYjpA