In the 20th session of Chandoo.org podcast, lets save some time.

What is in this session?
We all want to save time and stay productive. The obvious answer seems like using keyboard shortcuts. But they can only get you so far. So what about the real productive strategies? That is what we address in this podcast.
In this podcast, you will learn,
- Announcements
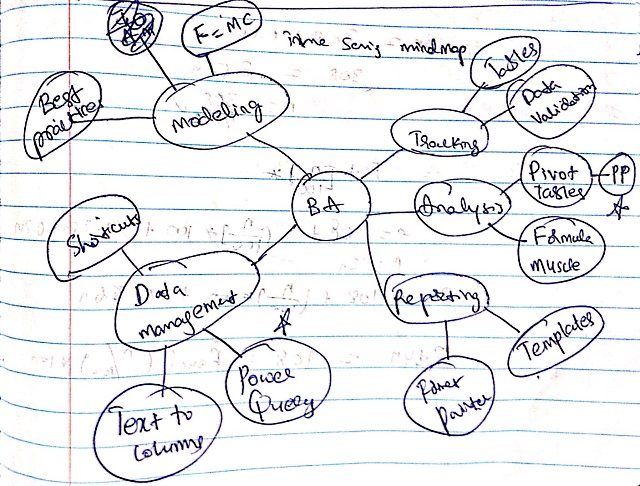
- 5 key areas of business analyst work – tracking, analysis, reporting, data management & modeling
- Time saving strategies for tracking
- for analysis
- for reporting
- for data management
- for modeling
- Conclusions
Here is a mind-map of this podcast.

Listen to this session
Podcast: Play in new window | Download
Subscribe: Apple Podcasts | Spotify | RSS
Links & Resources mentioned in this session:
- Tables: Use them to structure data & track easily
- Data validation: Use it to ensure that your input data is clean
- Pivot tables: help you quickly summarize data and get results (check out podcast session 18)
- Formulas: learn them to analyze better (also check out the podcast sessions 2 & 7)
- Format Painter: copy formatting from one range (or chart, object) to another easily
- Keyboard shortcuts: use them to save time (my favorite shortcuts podcast)
- Modeling best practices: Follow them to save time & create better models
Transcript of this session:
Download this podcast transcript [PDF].
How do you save time? Tell us quickly
So how do you save time when working with Excel? Please share your tips, suggestions and stories with us in the comments area. But be quick. I don’t want to waste time waiting for your comments 😉


16 Responses to “CP020: Top 10 time saving strategies for business analysts”
Familiarize with Keyboard shortcuts really save lots of time.
Cheers,
Thanks so much for providing great topics and content, Chandoo!
The PDF transcript doesn't seem to be working though. Is anyone else having that issue?
No its downloading and working fine
Without a doubt, using a standard approach based on the rS1.Method by Rheinhold Scheck.
As a BI analyst, The rS1.Method has allowed me to design, build, review and support all of my models without ever having to re-learn each one after a prolonged period of time.
I have saved so much time in every area simply by being methodical and structured. Whilst I use non-volatile formulas (mainly Index and Match) in place of the recommended Offset, and I have revised the worksheet layout for ease of reading and review by the uninitiated, I do use the recommended methods for each functional part of a model build.
My models are, largely, as described by the method, meaning anyone else could quickly understand and maintain, deconstruct and expand them, saving even more time and enhancing productivity.
My thanks go to Rheinhold for publishing the method in 2008 and to Chandoo for the article on this website that lead me to seek out what it was.
LeonK
Hi chando, works as a data management executive and also do some analysis on inventory Management. But Need to analyise big of the company. Please share the tips to be productive at job and how once can be a good in business analyst.
I Always try put some extra efforts at begining of the anaysis & Reporting & give if some automation features so that in future i have to spent less time in prepearing the report.
Hi Chandoo, I am working on excel for reporting team. Can you please help me with all the excel shortcut keys to do my work more effectively. eg: shortcut for creating pivots and many other functions in excel. Thanks in advance
@Deepa9
There are a number of posts on Excel Shortcuts
Use the Google Search at the Top Right of this page and search for Shortcuts
Wonderful session...
Please let me know the price for PowerPivot course for Indians in INR...
Cheers
It might not seem like a timesaver but believe me it is....
Whenever possible program in Boolean. I managed to create a cashflow model with over 2 million formula that recalculated in less than 500 milliseconds. I avoided almost completely using any if statements, vlookups etc.
It was blitzing on the recalc but if I had to add in another row it would take about 60 seconds to make the adjustment.
awesome session, looking forward to the next one in the row...
I often paste data from Excel workbooks into the body of email messages. When I do, it often wraps data onto multiple lines, making the data harder to read. To combat this, I wrote a quick macro to add 1 to all the active columns in my spreadsheet. Now my data looks much better! Enjoy.
Sub ColumnWidthPlus1()
'
' ColumnWidthPlus1 Macro
'
Range("A1").Select
Do Until ActiveCell.Value = ""
Selection.ColumnWidth = Selection.ColumnWidth + 1
ActiveCell.Offset(0, 1).Columns("A:A").EntireColumn.Select
Loop
Range("A2").Select
End Sub
Thank you chandoo.. You are doing the great job.. This podcast will surely help most of the BA's and beginners in the industry. May god bless you with lot of success and happiness for sharing your knowledge with us.
All the best. Have a great trip...
Chandoo,
Do you have any quick tips on generating (lots of) fake data (prefferably with a some trends and correlations) for dashboard prototyping? I was hoping PowerPivot's muscle for big data could be leveraged for that, too.
very useful session, I should have been on Chandoo.Org earlier, very happy to join your site.
AMAZING simplee Thank you Chandoo. I have translated into Spanish for my friends!