
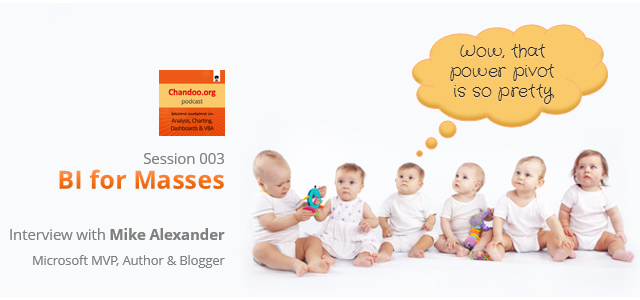
In the third session of Chandoo.org podcast, we are going to get BI curious. 😉
Not that kind you silly, We are talking about Business Intelligence, Big Data, Power Pivot & other Power BI family members.
First some good news: We hit #1 on iTunes in our category
That is right. Around 14th of March, we hit #1 in our category of podcasts. Yay!!!
Please take a minute to subscribe to our podcast:
- Chandoo.org Podcast is on iTunes: Click here to subscribe.
- Our show is on Stitcher and Windows Phone Podcasts too: Click here to subscribe on Stitcher. For Windows phone, search your podcasts app for our show.
- As always, you can get latest episodes, show notes & resources from our Podcast page.
What is in this session?
In this session, I am happy to feature Mike Alexander – Microsoft MVP, Author, Blogger & a good friend. Mike talks about how Excel is shaping the BI (Business Intelligence) revolution with advent of Power BI functionality.
- 10% discount on Mike & Bill’s upcoming Power BI Bootcamp in USA
- Free Excel Dashboard Tools add-in
Listen to the podcast to know how to get these.
You will learn,
- Introduction, what Mike is up to these days?
- What is BI, what does it mean to an average Excel analyst?
- What BI capabilities Excel has – brief intro to each of them
- Power Pivot & what it does
- Power Query & why it is important
- Power View & how it works (and where it sucks)
- Power Maps
- How to learn about these new technologies
- Recommended Books
- Websites
- Courses
- Live classes
- Special gift for our listeners
Go ahead and listen to the show.
Podcast: Play in new window | Download
Subscribe: RSS
Links & Resources mentioned in this session:
Mike’s website – Data Pig Technologies
Books mentioned
- Microsoft BI Tools for Excel Analysts by Mike, Jared & Bernard
- 101 Ready to use Excel Macros by Mike Alexander
- Excel Dashboards & Reports by Mike Alexander
- Power Pivot for the Data Analyst by Bill Jelen
- DAX Formulas for Power Pivot by Rob Collie
- Power Pivot Alchemy by Rob Collie & Bill Jelen
- Author profiles of Chris Webb & Mike Alexander
Power Pivot related articles & resources
- Why Excel shines & where it falls compared to other BI tools [PowerPivotPro.com]
- Introduction to Power Pivot & how to use it?
Add-ins mentioned:
- SQL Server Data Mining add-in
- I could not get a link to the segmentation, clustering add-in I used way back in 2006.
Dashboards mentioned:
Courses mentioned:
Mike & Bill’s upcoming Live Class
Transcript of this session:
Click here to download the transcript.
Thanks to Mike
Thanks Mike for joining me and sharing your knowledge, humor and passion with our podcast community. As always, it was fun talking to you. I look forward to featuring you again in our show sometime.
- 10% discount on Mike & Bill’s upcoming Power BI Bootcamp in USA
- Free Excel Dashboard Tools add-in
Listen to the podcast to know how to get these.
If you enjoy the podcast…,
Please do these 2 things. It means a lot me & our community.
- Subscribe to our podcast on iTunes
- Please leave an honest review on iTunes by clicking here.. It will help the show & its rankings immensely. Thank you so much.
Do you use Excel’s BI capabilities?
Do you use Power Pivot et al? How do you like them? Do you feel these tools empower you & your business? Please share your experiences & thoughts in comments.


86 Responses
Chandoo and Mike,
Love the POD cast on Business Intelligence (BI) and should have more sections like this. it was great…
Another great podcast Chandoo. Probably my favorite to date! Learning more about these Excel BI tools is definitely on my list. I do have one question for you….my current company is using Office 2007 and therefore doesn’t have access to some of these BI tools (PowerPivot, etc…). I do however own Office 2013 at home. How would you suggest learning these tools from a home setting with no ‘real world’ data or databases to use?
Good day Chandoo & Maike,
loved the podcast, it was really both informative and entertaining. looking forward for the upcoming BI for analyst book.
Thank you both for such an awesome post.
Cheers,
Munir
Chandoo and Mike,
Love the podcast!!!!!
Between the neighbors, the adoption and chandoo’s archive
the discussion on Business Intelligence (BI) was powerful and insightful….
Well done guys!!!
Thank you Chandoo and Mike, that was a great discussion. I’ve seen bit and pieces about BI in excel, but haven’t worked out how they would fit into what I sdo at work. Now I’ve got a great list of resources, and the motivation to find out more.
Chris:
Yeah Office 2007 doesn’t support the new BI stuff. I hope your company moves up.
As far as your Excel 2013 version at home, it depends on the version you have.
To be able to use the new BI tools in Excel 2013, you’ll have to have either:
Office 2013 Professional Plus
OR
Excel 2013 Standalone Edition (you can buy on Amazon for around $99)
OR
Office 365 Premium subcription.
Provided you have the right version of Excel 2013, you can start playing with sample data.
The Windows Azure Data Marketplace is an excellent source for all kinds of free datasets. Just visit the URL below, sign up for free, then you’ll be able to download hundreds data tables to play with.
https://datamarket.azure.com/browse/data
Thanks for the response Mike! Luckily I have the Professional Plus version at home. Thanks for the link to get me started! Cheers!
Great episode. I can definitely relate to Mike regarding the ETL process in his beginning years. Have a couple macros set up for this exact reason right now actually.
I await our institution’s move to Excel 2013 with much anticipation.
Good podcast! Looking forward to checking out the add-in…
Loved the talk! Nice info and good fun.
I enjoyed the podcast and the washing machine bit was hilarious. Excel and PowerPivot are more powerful than ever and definitely worth investing time into learning.
After listening to the podcast, I am anxious to give Power Query a try. Thank you for sharing your knowledge, and for both and educational and entertaining podcast!
Great podcast. Appreciate the information presented here, and looking forward to future information.
I have only recently been working with the Power Pivot and have become even more impressed with Excel. Thank you for the podcast and sharing your thoughts about the relative merits of the various pieces of Microsoft technology and where this stuff seems to be heading. Thanks!
Great podcast topic covering BI using Excel. I wasn’t aware of the new technologies/capabilities as I’m still on Excel 2010. Keep up the great work!
Thanks Chandoo and Mike, great session! Mike’s a character, definitely hope to see him back on the show.
On somewhat of a side note, hope that MS will look to broaden the availability of their BI offerings (ref Mike’s reply to Chris above)… Give businesses and personal/individual users, i.e., everyone – more options for getting their hands on this stuff.
Great podcasts! Keep up the good work! Am I in to receive Mike’s dashboard addin?
Your website is a great help. Loved the podcast
Great podcast. This is the first podcast I listened to the end. Great insight into BI. Thanks a lot to Mike Alexander and you. Hope you will have other great Excel Gurus in your future podcasts.
Hi Chandoo & Mike,
The Podcast cast on Business Intelligence (BI) is really awesome…
Chandoo… Are you on SoundCloud as well? That would really help people who are on Android.
Thanks
where can I find the
Free Excel Dashboard Tools add-in
??
This was a great podcast. Got learn a lot from 2 of the brilliant minds in Excel and it was really entertaining. Inspirational and Motivational. Looking forward for the release of Mike’s new book on Microsoft BI tool.
Nice work guys.
Power Map is certainly something I’ll look into. I’m doing some work with a NPO (non-profit organisation) called Greenpop. They plant trees in impoverished areas for free, especially low income schools, here in Southern Africa and for them to get a visual representation of all the hard work they do will be amazing.
Thanks for helping to broaden our minds.
Thanks for the podcast. I look forward to reading Microsoft Business Intelligence Tools for Excel Analysts
Just listened to my first episode of the podcast – loved it!
I’ve enjoyed both DataPig and Chandoo.org for quite a while now, and it was fun to hear both of enjoying yourselves so much.
I’ve been wanting to get into Power Pivot for some time – this podcast may end up getting me to make the jump into this powerful tool.
Awesome Podcast!
Exciting stuff. I’ve heard of Powerpivot before but was never in the KNOW. Understanding now of the paradigm shift and the Microsoft BI stack for Excel, I think it’s really time to migrate from 2007.
Chandoo – great idea starting up a podcast.
Mike – I know MrExcel. I know Chandoo. and now I know BACON! You’re awesome bro.
#OpenXL
#BaconBits
#Kenmore (Lol)
Thanks for (another!) great podcast, Chandoo! As someone new to the corporate BI/”big data” space, it was wonderful to hear your and Mike’s thoughts on how Excel can be used instead of some of the clunky, complicated legacy systems that many companies seem to rely upon.
Thanks!!!
I found Chandoo blog just a 2 weeks ago. It’s great page and excellent podcast (I love this podcast idea very much). I expect to have a great fun with Excel Dashboard Tools add-in.
That was fun! thanks for putting it together… these tools all seem a bit more approachable now. You both are extremely awesome, I’m looking forward to future podcasts. 😀
Great episode! I’m on a steep learning curve with Microsoft Power BI and I owe much of my knowledge to Chandoo.org. I totally agree with the Power View comments regarding making one feel “Powerless”. I hope it improves – there is great potential there. Thanks!
Fun conversation – Interested in testing out Mike’s add-in.
Another enjoyable episode.
Fantastic podcast. Thanks for connecting the dots on all the available BI tools for the Excel warriors out there.
As always, it gets more complicated before it gets simpler. Fun to see Excel grow up into a relational structure.
All the best, Chris
Hi Chandoo,
Excellent podcast..had lots of laugh in between..I would recommend this podcast to all my friends.
and Mike waiting for your book to be released
Great explanation of BI for the regular person. Chandoo, keep on with these great podcasts!! Loved the explaneation of PowerPivot and Power Query.
The best take-away of the podcast was that “No one advertises for excel gurus”. So true… Good insights on PowerPivot; guess time to learn the “nth” thing in excel.
Thanks Chandoo & Mike…
Very good podcast indeed. Hope Chandoo got his neighbour enrolled in the course 🙂
Chandoo, am getting an error msg on trying to install the add in… Does it work only on 2010 and above? I have 2007 installed…
Pls help.
Thanks Chandoo and Mike
I had a great time listening to this podcast. Loved it.
I m looking to learn more on BI once I m done with certain classes at Chandoo
And Mike you have earned a fan and Chandoo thanks for such a god podcast
P.S. I have missed your archives. Can you kindly paste the link to all those
Krishna
Hi Guys,
This is my favourite of the three podcasts so far and covers interesting information in a way suited to a podcast (things like formula syntax is difficult to communicate without seeing it written down).
Learning more about the Power BI tools is now definitely on my list, I just need to find a big project at work to sink my teeth into 🙂
Great Podcast! I’m ashamed to admit, but I’ve always been intimidated by PowerPivot and PowerQuery, even though I’m considered the best at Excel in my company. This podcast has inspired me (by not wanting to be left behind in the new revolution of Excel) to learn these tools.
Love the podcast. Keep up the good work.
Great podcast, listened to it, and really helped me think about what excel BI is becoming and how its evolving
Hi Chandoo,
As usual, lively and informative session. I never knew there was a data mining add-in for excel. This session really helps in understanding the BI potential in Excel, how things are evolving in this area etc. Great session overall. Thank you.
Jay
Great post. Mike, good to see someone else has digged into the archives, with a view to writing them up. I’ll send you my early attempt that Chandoo has completely ignored (in fact, he didn’t even tell me he was ignoring it. I heard it here first. 🙂
You’re right…early on the site is part travelogue, part student diary, part marketing insight, part social commentary/satire, part advert critique.
here’s some of my favorite articles from Chandoo’s archives:
http://chandoo.org/wp/2004/11/04/smirnocked/
http://chandoo.org/wp/2004/11/24/are-you-doing-blowjob/
http://chandoo.org/wp/2004/12/02/i-stink-therefore-i-exist/
http://chandoo.org/wp/2005/02/25/madhu/
http://chandoo.org/wp/2005/08/29/recipe-of-my-lfe/
…but here’s the funniest by far:
http://chandoo.org/wp/2005/07/11/dude-where-is-my-fullstop/
I love some of the inappropriateness of the early posts. But I see that that boundary-pushing was still in play in late 2008 with http://chandoo.org/wp/2008/09/26/visualizing-sex-love-10-must-see-infographics/ (although I can’t believe Chandoo did not replicate The Authentic Woman’s Penis Size Preference Chart in Excel.)
What was also interesting was the post 500 days of PHD:
Somewhere during the IRIS and loads of sleep and laziness, my blog has finished 500days of existence. Congratulations PHD
Interesting, because the blog was 500 days old, and Chandoo had yet to actually post anything in regards to Excel on it.
I miss those days. 🙂
This podcast was very interesting. I have become a major proponent at work of changing how reporting is done. This podcast helped me to see more ways to improve or reporting
I may pitch to them that we should dpsend people to Bentonville in April.
Hi chandoo,
how can i get my free dashboard tool add in.
Mike, really enjoyed your point of view. I’m a VBA/Java/Ruby/Clojure programmer, but for ETL I’m using Power Query, especially since the underlying M language is powerful. Also a big fan of Q&A as feature of Power BI that the execs might use.
Still can’t find the add in
still cant find the ad ins
Hi Jack… thanks for your comments. Please be patient. We will be emailing download link to the add-in in next 2 days.
Another fantastic episode Chandoo! Please keep them coming; they’ve all been really interesting and I’ve learnt a lot so far.
@all.. thanks for the lovely comments. I am really happy to feature Mike in our podcast.
I will be sending you a link to download the add-in shortly (by Wednesday).
Chandoo, I’m really loving this podcast. To be honest, I was concerned how it would work, because Excel is not really an auditory experience(!), but I’m finding it very interesting. Keep up the good work, Chandoo.
And, by the way, despite what Mike might have said during the early part of the podcast, on my iPhone the Chandoo.org podcast does appear between some esoteric podcast subscriptions (in alphabetical ordrer):
“The Bugle”
“Chandoo.org”
“Comedy of the Week from BBC Radio 4”
“An Irishman Abroad”
“The Smartest Man In the World”
“NPR: Snap Judgement”
“Stuff You Should Know” and
“This American Life”
These are among some of my favourite subscriptions, and that I look forward to downloading and listening to every week, but chandoo.org is the only business/excel related one.
Great 3rd show Chandoo! Loved the format and discussion, kept me listening happily on the way to and back from work. Please keep them coming as it was really good to hear about the Power BI suite rather than just read it, makes much more sense now. Cheers.
Mike was very informative and entertaining. I hope you can have him back as a guest to discuss specific applications of PowerPivot and PowerQuery.
I may have input the wrong email address on my orginal post. Have you sent out the link to the Dashboard add-in? The one with this post is the correct address.
Hi Chandoo,
The best way to have a podcast is to have interviews, talk about broad subjects, discuss a new feature or technology. Think about it, we are just listening, we are not seing spreadsheets, and since most people are visual learners, trying to teach Excel via a podcast makes no sense, but it does for what you have done today.
I hope you keep it up in this format, it awesome.
Thanks,
Pablo
Hi Chandoo,
This was the first podcast I listened to and I’m glad I did!
Apart from being very informative its actually very entertaining. Mike is ridiculously funny and I love his analogies!
This is my first visit to your site after listening to your podcast and it seems like an absolute gold mine for information and can see that it will be very beneficial for me, so thanks in advance for that.
As there is so much information where would you recommend to start learning?
Looking forward podcast 4 already, keep her lit buddy! Good luck
Excellent talk. I’m an enrollee of many of Chandoo’s classes and love them all. I recommend the latest on Power Pivot to everyone. Can’t wait to get the book Mike has coming out too. Keep up the great work and thanks for your help in making us all awesome in Excel.
Fantastic podcast and a great episode, Mike is hilarious!
I had heard of the new BI tools and looked into them a little bit but this has got me really excited about the potential of what I will be able to deliver at work. For me Power Maps will be awesome! Can’t wait to get Mike’s new book 🙂
Enjoyed session 3 and am looking forward to exploring Mike’s dashboard. Thank you, Tim
Hi Chandoo,
Received an email w/ a link to the add-in (Thank You & Mike!) – but so far no luck using it… Wanted to ask if you could please help me out w/ a new link, if it’s not too much trouble? Following the link leads to an error page, as seen below (the “…” are just long strings that change w/ each attempt). Thanks again.
“This XML file does not appear to have any style information associated with it. The document tree is shown below.”
-
AccessDeniedAccess Denied
...............
-
...............
Not sure if I have made in the first 50, but loved the podcast, what can you say about Mike?? He’ll do well as a scriptwriter too! Extremely funny guy! And thanks Chandoo & Mike for the episode, it was very informative
Hi Chandoo
You are awesome! I hope i am not to late to receive the excel add in.
Thank you.
Chandoo,
Love the podcasts! Have used your website for years, keep up the good work!
Am hoping I am still in time to get a copy of Mike’s add-in
Thanks
Mike, Chandoo thanks a lot for the excellent podcast. Really keen on trying to learn about the new Power add-ins.
Also, looking forward to when “101 really useful excel formulas” book come out. Loved the excel dashboards and reports book.
Great podcast chandoo. Many analyst now struggle with the decision of using excel for dashboards vs tools like Qlikview. Would love to hear where you see excel stand out against these.
Great podcast! You two had great chemistry!
Is there a link to Power Maps?
Terrific podcast! Wish I had heard it sooner to be one of the first fifty to respond but regardless, I truly appreciate you making me awesome at Excel!
Another fantastic episode Sir!
Sir, i did MBA and right now pursuing PHD. i want to know which is better software for research work SPSS or Excel ??
Dear Chandoo & Mike,
I want Free Excel Dashboard Tools add-in……I hope I am in first 50 people who are commenting on your session.
Definately it is helpfull.
Thank you,
Kavita
Hi Chandoo & Mike,
Great podcast, you guys are naturals.
@Mike – You should think about getting your own podcast as you are a naturally funny guy. Excel is meant to be fun to us nerds 🙂
@Chandoo – These podcasts are great and I learn something new every time I listen. Without your knowledge sharing I wouldnt be where i am today.
Thanks guys and I cant wait for another one of your podcasts.
John Michaloudis
Great podcast, love the style and really appreciate the learning – specially about the data-mining add-in and some of the other Power addins.
Many thanks!
Really good interview. Excel is the future for business managers that can’t receive the right and timely support it needs from IT.
Thanks! Great podcast. Really appreciate you both sharing your knowledge with us.
Thank you Chandoo and Mike, that was a great discussion.
I want Free Excel Dashboard Tools add-in……I hope I am in first 50 people who are commenting on your session.
Regards,
Ashish Mehra
Looking forward to Mike’s book. I also believe the world of Excel is changing, becoming even more sexy! If we are able to become proficient in Powerpivot we are going to look like super stars at work! You both have inspired me to finally start playing with Powerpivot this week. Loved the jokes.. makes it fun with is normally a pretty straight conversation!
Free Excel Dashboard Tools add-in???
Regards,
Ashish Mehra
Hi Ashish,
Thanks for your comments. The free add-in was only for first 50 commenters. You are number #79.
Hello, if we are not able to get the add-in for free, it is possible to buy it? also, Chandoo! you rock!
HI Carlos, it seems that you and I are probably the two first Peruvians listening to these awesome MVP’s Chandoo and Mike Alex. Greetings
Hi Chandoo,
I had listen to this podcasts session 3 completely & i came to learn so many new things. Thanks for sharing such huge excel knowledge.
I had listen to this podcasts session 3 completely & i came to learn so many new things. Thanks for sharing such huge excel knowledge.
Discovered the podcast recently and really enjoyed this episode. Really inspired me to start look in to the Power BI tools.
interesting podcast. what would be the current books you would recommend for the beginner in power BI