
Many of us want to learn advanced Excel and make progress in our career. But how to do it?
In this post, I show 3+1 ways in which you can learn advanced excel.
Last week I did an interview with Robert Mundigl of clearlyandsimply.com. Robert is an Excel wizard. You may know him thru the KPI Dashboard articles he has written on chandoo.org a while ago.
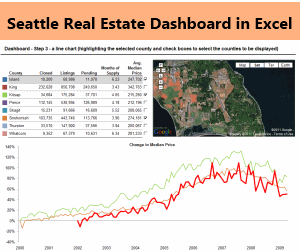
We spent about 90 minutes discussing some really cool & advanced Excel stuff. The interview will be available shortly on Excel School for our Dashboard students. But here is a snapshot of the dashboard we discussed in the interview. Robert taught me how to make such a dashboard using Excel.
Anyhow, I digress, so lets comeback. The topic of this post is 3+1 ways to excel in Excel.
1. Join Excel School:
 Of course, the best possible way to learn Excel is to go thru a class. This is a proven approach and the 900 students of Excel School are a glowing testimony that it works. I believe that, by investing as little as 2-3 hours every week, anyone can become really awesome in tools like Excel. Sometimes, the benefits of training program are far-reaching, like the case of Ceri Williams, Excel School student in batch 1, 2 and 4:
I want to share some good news with you ! In recognition for my outputs & assistance to others, BT and recently made me an Excel SME (subject matter expert) … there’s only 9 of us in BT (100k+ employees in BT, and I’m the only one in BT Retail ~25k employees). Whilst I always considered myself as having strong excel skills I can honestly say your blog & tuition has taken me to a different level. So a massive thank you for sharing your knowledge & experience !!!
Key areas I think I have developed the most are :
– Integration of advanced functions to meet the needs of everyday problems (and even using simple ones to better effect) !
– Simplifying my style for visualizing data … I confess I use to add a few bells & whistles for my own guilty pleasures to old charts as opposed to delivering what they were designed for .. deliver simple, clear messages.— Ceri Williams
You too can become like Ceri or countless other students who become awesome at their work just by learning the ropes of Excel.
2. Learn Financial Modeling & Project Finance
Excel is used very much in financial industry because of the powerful analysis, modeling and calculation features it has. That is why, learning Financial Modeling or Project Finance modeling using Excel can be great career move.
We have concluded our first batch of financial modeling school recently and re-opened the program for students this week. So far, we already have 31 students in the program and many more are joining each day.
You too can join the program and become a financial modeling ninja.
For details & sign-up instructions, visit Financial Modeling School page.
3. Learn Excel Dashboards
Excel dashboards & Excel based Business Intelligence is another emerging area. Due to its ease of use and ability to integrate with database systems, Excel is a favorite among people building dashboards.
But making a dashboard is an arduous, complex process. And this is where, you could use step-by-step instruction and example material.
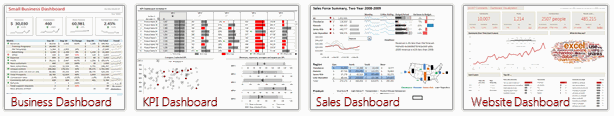
If you wish to learn Excel Dashboards, I recommend joining Excel School with Dashboards Option. It is an excellent program that teaches all things in Excel School + video instruction on making 4 different type of dashboards – KPI Dashboards, Business Dashboards, Sales Dashboards and Website Dashboards. There is a wealth of bonus material, dashboard tips & interviews with more than 10 hours of video content.
Click here to learn more about the program and Join.
+1. Read something new & Play with examples
Even if you are not ready for a paid program to learn excel, you can still excel in Excel by just reading 1-2 articles on Chandoo.org or any other Excel blog once a week. For starters, I recommend reading any article on these pages,
- http://chandoo.org/wp/category/best-of-phd/
- http://excelhero.com/blog/
- http://contextures.com/tiptech.html
- http://peltiertech.com/Excel/Charts/ChartIndex.html
- Or get any book featured here.
That is all for now. Go on and become awesome in Excel.


12 Responses to “Sachin Tendulkar ODI Stats – an Excel Info-graphic Poster”
A great tribute to one of the greatest batsmen's in Cricket history.
Thanks Chandoos!
A fantastic poster, Chandoo. I suspect most people would assume it was done in Adobe Illustrator.
Great work!
Daniel Ferry
excelhero.com/blog
[...] Visit his post to download the excel file: Sachin Tendulkar Statistics Excel Infographic Poster [...]
[...] Courtesy: Wikipedia.org >> Chandoo.org [...]
Please update the pingback url to http://www.newsilike.in/sachin-tendulkar-infographics/
Awesome man .....super work
[...] Wikipedia.org >> Chandoo.org ← Previous Next [...]
[...] Kummi in Blog, Dashboard, Excel, Infographic | No Comments Jan252012 Chandoo.org published an infographic poster created in Excel. As a big fan of Tendulkar, I really liked this [...]
[...] Via Tags: europe, football, european league, soccer, sports © 2012 Latest Infographics /* */ [...]
[...] Source [...]
[...] Link [...]
[…] Source […]