Calculate CAGR (Compounded Annual Growth Rate) using Excel [Formulas]
Here is a story we all are familiar with,
Jack learns about compound interest in school. He quickly forgets about it while learning other complicated things like trignometry, partial differentiation, correct spelling of trigonometry etc. Jack graduates and ends up with a job he loves / hates. Years pass and one day out of boredom jack looks thru mail and stumbles on a credit card bill. As Jack has nothing else to do, he opens it. He looks at something and wonders why his credit card number has only 7 digits!
Then he realizes that it is the amount he owes to credit card company!!!
Jack scratches his head vigorously and wonders how the tiny bits of money he spends on gas, toothpaste and occasional pizza can add up to $19,234.55 ?
Then he realizes the true power and meaning of compound interest!
The moral of the story: Never open a credit card bill.
Of course the real moral is, understand the power of compound interest and use it to your advantage.
But we are not here to talk about unhealthy money habits.
We are here to talk about awesome benefits of Excel.
So moving on, lets talk about how we can use Excel to calculate Compounded Annual Growth Rate (CAGR for short).
What is CAGR? What does it signify?
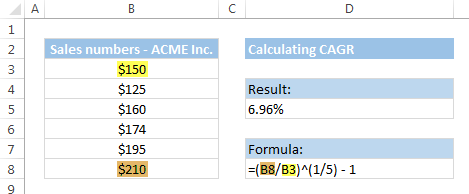
Let us say you are the CEO of ACME Inc. You have been selling various widgets since 2009. In your latest annual report you want to tell your shareholder at what rate you have been growing ACME Inc. sales. The figure are,
- 2009 – $150 Mn
- 2010 – $125 Mn
- 2011 – $160 Mn
- 2012 – $174 Mn
- 2013 – $195 Mn
- 2014 – $210 Mn
Now, if you see the growth rates, they are all over the place. Right from -16.67% to 28%. But you want to report a single annual growth rate.
This is where CAGR (Compounded Annual Growth Rate) comes handy.
Imagine that the sales of ACME Inc. grew at constant rate every year from $150 Mn in 2009 to reach the $210 Mn in 2014. This is what CAGR represents.
As you can see, CAGR removes all the volatility in the numbers to tell at what uniform rate the numbers grew (or declined) every year.
Arithmetic behind CAGR
While we can never explain the arithmetic behind how credit card companies calculate interest, penalties, fees, interest on penalties and miscellaneous charges, we can easily understand the logic of CAGR.
You see CAGR uses the all important compound interest math at the heart.
Lets throw a few variables in to this article now:
Lets say the starting value is P (in our case P= $150 Mn in 2009)
End value is A (A = $210 Mn in 2014)
and N represents the number of years it took P to become A. In our case N is 5 years.
R denotes the rate of growth (CAGR).
The basic equation is

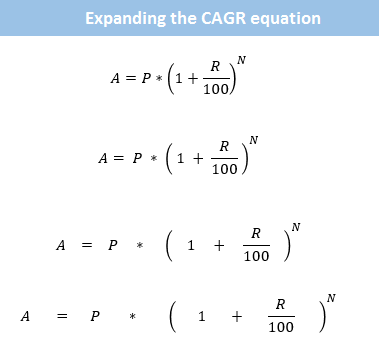
A = P *(1+R/100)^N
And we need to find R.
So lets do some simple Arithmetic. Lets expand,

not that kind of expansion, you silly!
We need to do this:

The final equation for R is =(A/P)^(1/N) – 1
Calculating CAGR in Excel
Now that we have finished a crash course in arithmetic behind compound interest, we can calculate CAGR in Excel. There are 3 ways to do this.
- Using raw arithmetic as shown in above equation.
- Using RATE formula
- Using IRR formula
Using arithmetic equation for calculating CAGR
 This is simple. Assuming,
- P is the initial value
- A is the last value
- N is the number of years
in a blank cell, write
=(A/P)^(1/N) – 1
And you get the Compounded Annual Growth Rate as output. (Just need to format the cell as %).
Using RATE() formula
 RATE() is a financial formula (function) in Excel that can tell us what would be the interest rate for an annuity. Sounds complicated? See this example:
Lets say, as the CEO of ACME Inc. you took a loan of $30Mn to expand your company. You agreed to pay $5 Mn per year for next 10 years to pay off the loan. So what is the effective rate of interest?
=RATE(10, 5, -30) tells us that the rate of interest is 10.558%
We can use RATE() formula with below parameters to calculate CAGR,
=RATE(N,,-P,A)
Explanation:
In our situation, we want to know at what uniform rate the sales grew from $150 Mn in 2009 to $210 Mn in 2014.
This is same as taking a loan of $150 Mn in 2009 and paying off $0 per year for 5 years and paying one lump-sum payment of $210 Mn in 2014.
So we use =RATE(N,,-P,A) to indicate that we are paying $0 per year (hence omission of 2nd parameter) and paying one lump-sum amount at the end.
Using IRR() formula
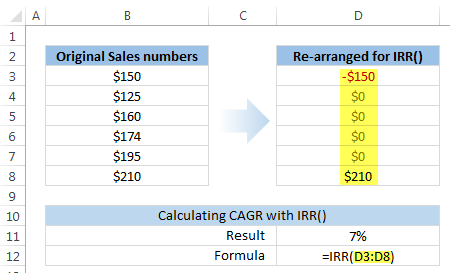
While the above 2 formulas do not require any changes in the original data, this one requires that we re-shape the data.
See this picture:

So original data in B3:B8 is re-shaped in D3:D8,
Now, use =IRR(D3:D8) to get the rate of growth (CAGR).
Related: Using IRR() function over a dynamic range with OFFSET.
Other scenarios where CAGR is helpful
- You purchased some shares at $100.00 per share on 1st of February 2007. You sold them off at $270.13 per share on 3rd of April 2014. What is your annual rate of return?
- Your website traffic was 15,000 page views per month in Jan 2012. In March 2014 it is 75,000 per month. What is the monthly growth rate?
- You had 10 paying clients when you started business 5 years ago. Today you have 300. What is the annual growth rate?
So what method do you use to calculate CAGR?
I have always relied on the brute arithmetic calculation of (A/P)^(1/N) -1. I guess derive strange pleasure writing equations in Excel cells.
What about you? Do you compute CAGR? Where do you use it? And what method do you use to calculate it? Please share your tips & thoughts in comments.
Feeling love towards money & modeling it in Excel?
While it may take us forever to earn few millions or pay off that student loan, we can model all of that in Excel in a few hours! Here are a bunch of articles to help you get started with just that.
- Financial modeling using Excel (6 part tutorial)
- Mortgage calculator using formulas & form controls
- When can you retire, find out using goal seek
- Growing a money mustache using Excel

Hello Awesome...
My name is Chandoo. Thanks for dropping by. My mission is to make you awesome in Excel & your work. I live in Wellington, New Zealand. When I am not F9ing my formulas, I cycle, cook or play lego with my kids. Know more about me.
I hope you enjoyed this article. Visit Excel for Beginner or Advanced Excel pages to learn more or join my online video class to master Excel.
Thank you and see you around.
Related articles:
|
Leave a Reply
| « How to become an MVP in Excel [case study] | CP007: aweSUM() – Overview of SUM functions in Excel » |

 At Chandoo.org, I have one goal, "to make you awesome in Excel & Power BI". I started this website in 2007 and today it has 1,000+ articles and tutorials on data analysis, visualization, reporting and automation using Excel and Power BI.

34 Responses to “Calculate CAGR (Compounded Annual Growth Rate) using Excel [Formulas]”
I use the power formula to calculate the CAGR.
power(A/P,1/5)-1
Very well written Chandoo. Great explanation.
Thank you Mike. Your compliment means a lot 🙂
Back in the dark ages I was taught that CAGR (or AAGR - Average Annual Growth Rate) was the exponential growth rate of the line that best fit all the data. i.e., that you had to consider the data from all of the data points. The 6.96% CAGR you calculate ignores the performace in intervening years, notably the large sales drop in 2010. Therefore I would use LOGEST(B3:B8)*-1 and say that a more representative estimate of the average compound growth of ACME's sales over the period from 2010 to 2014 was 9.26% - more attractive than 6.96%. If ACME's sales were: 150,220,230,240,180,210 your calculations would still yield 6.96% while LOGEST would calculate the average growth to be 3.26%.
Using IRR to calculate the rate of growth of sales is not strictly speaking a correct application of the IRR concept IMHO. The IRR function is intended to measure the return on an amount invested. In your example the final sales figure would represent the amount realised at the end of the investment term rather than the level of sales ( or any other variable) at a particular time. But interesting application nevertheless.
Also an interesting post about LOGEST function Bob. How does it handle negative values ? As you know the IRR doesn't handle negatives very well, sometimes producing two or more solutions to the same problem.
I always use the full mathematical formula and have never considered the notion of using an Excel formula as an alternative. Of course, I then always verify the CAGR by plugging it back in and making sure I end up at the correct number. So much for shortcuts.
LOGEST doesn't handle negatives well at all. If ACME had negative sales that would probably be a signal to avoid them. However, if looking at profits and some periods were negative we would have the formula return "NMF" - No Meaningful Figure - instead of the #NUM! error and then use cumulative profits/cumulative sales to compare competitor profitability (or couple Sales Growth with absolute improvement in % Return on Sales over the period being analyzed.) Three key measures: Grow sales faster than your world (i.e. gain market share); grow your income faster than your sales (i.e. improve ROS/become more efficient); and grow cash faster than your income (effectively manage your assets).
Hi,
Cagr could be used only for those parameters, where you are having a kind of closing stock. Opening stock etc. But in calculating the growth rate of Gross State Domestic Product and such a kind of parameters, then this formula could not be used. Only mere arithmetic average could be used. Because, the Value added to the particular years are only taken in to account for GSDP. Any comments, chandoo, Am I correct
Hi Jraju.. I think CAGR works even in such cases too.
When someone says Country X's GDP grew by 8% on average in the last 5 years, I would imagine the GDP grew from 100 to 136 in 5 years, not 132.
When you explain 100 to 136, 8% would be the CAGR.
Hi,
Chandoo, could i expect your views on my point above about using arithmetic average for gsdp
Hi, chandoo,
Please review the use of cagr in gsdp . The gross value added from each sector for the year only has been taken in to the calculation of GSDP. There is no opening stock or closing stock to brought forward in such case. So, only arithmetic mean, that is the growth rate of each year divided by the no of years is the possible way, as far as i know. Expecting your clarification
I use =RRI(nper,pv,fv)
It is very simple
Nice explanation.
Very beautiful, but can further explain how to calculate a compound monthly growth rate (CMGR).
Thank you
Hi, Chandoo
Expecting your clarification on using cagr in gsdp
Hi Chandoo,
How to calculate if I hv yearly growth rates and not absolute figures.
If you have no absolute values you can set the first year to 1 and construct an an annual index [prior period index * (1+ Annual Growth Rate)] for each year. The Compound Growth Rate of this calculated index, calculated using the Logest function as I suggested in above comments, will be the same as if you had all the actual values. I assume the other calculation methods would work as well. As noted in above discussion, if an actual value (not the % change) is negative, calculating a meaningful CGR is problematical.
Many thanks Bob its really working...
Sometimes you might feel that CAGR is not an effective way of calculating the growth. For ex. in calculating the CAGR %, what is important is the Value during the base year & Value during the final year of calculation, all other values are non-significant. So irrespective of what growth rates are achieved (even 0 or negative) during the intermediary years, CAGR is calculated based on the final year results & first year results only.
I beg to differ with Umesh. I beleive that all the points in a trend are relevant. Would you rather have a business with periodic revenues of 10, 15, 20, 25, 30 or a stock with periodic revenues 10, 5, 20, 10, 5, 30? Some may like the roller coaster but others get sick. Ignoring intermediate points is quick and easy but ignores both cummulative revenues and very important volatility.
Bob - I was very happy to find your comments here. I've been warning folks for years about the pitfalls of the CAGR in terms of expressing historical trends, and it's nice to happen upon the same arguments by an independent source.
I've just started a blog about analyzing industries and markets, and I cover the topic here: http://theindustryanalyst.info/2014/12/30/the-cagr-handle-with-care/comment-page-1/#comment-2
Perhaps you'd be so kind as to review my post. (I hope to elaborate on LOGEST in a later post.)
Many thanks.
Bob - this is a better link: http://theindustryanalyst.info/2014/12/30/the-cagr-handle-with-care/
Mike - Nice clear article on CAGR versus AAGR. In many instances calculating a point to point CAGR can be very misleading.
Hi there - I am using the RATE funtion to calculate CAGR, using your example above. The "starting" point (2009) is annual sales for a product. The number is not negative, how do I keep the number positive in the spreadsheet, yet use the RATE function? I tried putting in a negative sign in the formula and it didn't work.... I had to change the first sales figure to a negative number. Thank you!
The negative sign has to be in front of the pv argument. So if your starting point value is in cell A2 then the formula should be RATE(number of periods , , -A2 ,ending value. If your values are in A2:A5, e.g., 10,15,20,25. Then the formula would be:
=RATE(3,,-A2,A5) which would return 35.72%.
I continue to think that using RATE is not the best way to calcualte CAGR - see my comments above.
Thanks. Here is a questions.
Would this brute arithmetic calculation of (A/P)^(1/N) -1 and RATE() formula work even when the value of N is LESS than ONE year - few months or days? In other words, would it work in the example below.
I purchased some shares at $100.00 per share on 7-JAN-2015. I sold them off at $120.00 per share on 3rd of 4-FEB-2015. What is the Annualized return I received?
Thanks in advance.
Very Nice explanation ..do liked it.
I was confused on one of the explanation given in other website but chandu is very nice to explain
You can easily calculate CAGR value using this web calculator.
http://www.stockcalculation.com/2015/06/compound-growth-rate-calculator.html
Calculated LOGEST on the below 2 different sets of data (difference being value for the 3rd year is 10 vs 800), however result is exactly same....hence this seems to be limitation of LOGEST.
120 120
150 150
10 800
200 200
240 240
18% 18%
@Vijay
Logest can be used as a function or as an array function
Using it as a function returns the Slope of a line of best fit or m value
In this case the 2 slopes are the same at 0.18 or 18%
One line has a larger Y Intercept than the other due to the 800 value
If instead you use Logest as an array function
Select a 2 Column x 5 row area
Enter =LOGEST(C2:C6,A2:A6,TRUE,TRUE) Ctrl+Shift+Enter
Then repeat for the other data set
Use the Excel help to lookup the Linest function where the array of results is discussed
You can also read about these parameters here:
http://chandoo.org/wp/2011/01/26/trendlines-and-forecasting-in-excel-part-2/
The RATE formula is calculated by iteration and does not always converge on the correct CAGR value when the inputs take unusually large or very small values. For example, in Excel 2007, RATE returns a #NUM error when asked to calculate the CAGR over 10 periods with P = 10 and A >707 (the correct CAGR is >53.08%). Conversely, RATE returns a CAGR of -99.999... % when asked to calculate the CAGR over 10 periods with P = 10 and A = 0 (the correct CAGR is -100%). So, the simple arithmetic and POWER approaches are more robust.
I have a question.... how do you calculate the rate of how fast sales have to go to keep the same market share
I support Luis suggestion of using =RRI () since it was made for this!
Secondly, some comments here reflect the situation in which we are dealing with exponential growth or logarithmic growth or some other non linear growth function. In such cases we need to use a CAGR calculation to reflect that.
I was wondering what the procedure would be to handle negative numbers in calculating CAGR.