
Today, we will learn an interesting array formula trick to test if a list is sorted or not.
During last one week, I got 2 requests from different clients for some excel related work. Both of them had one thing in common. To test whether a list is sorted or not. So I got thinking, how do I know if a list is sorted or not without visually scanning it.
Of course, the answer is in a formula.
Let us say you have a list of values (text, numbers or mixed) like this:
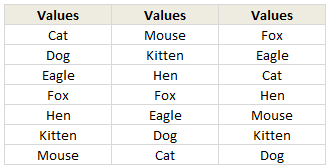
Assuming your values are in the range B2:B8
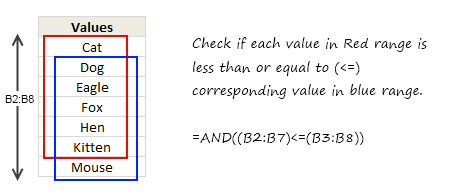
Write the formula =AND(B2:B7<=B3:B8) and press CTRL+Shift+Enter to make it an array formula.
The result will be true if the list in B2:B8 is sorted in ascending order, false otherwise.
How does this formula work?
Very simple. Assuming your list has n values, it check first n-1 values with their next values to see if each value is less than or equal to its next value. If all of them are true, the AND formula returns TRUE. See this illustration:
Download Example Workbook
I have made a simple example file to illustrate this technique. Go ahead and play with it.
Click here to download example workbook – Excel Array Formula to check if a list is sorted or not.
How would you write formula for this?
As fun homework, go ahead and figure out an alternative formula for this. Then come back and post it comments. Let us see how many different ways we can get the same result.
Go!


25 Responses
This formula work for sorting A to Z but not for Z to A.
I ammended it to
=AND(AND(B2:B7AND(B2:B7>=B3:B8))
to do both
Thanks a lot!
Very nice conjunctive truth table, Chandoo!
Jelle, I think you meant this
=OR(AND(B2:B7=B3:B8))
to sort in either ascending or descending order.
Quite nice. I played a while with this and tuned a bit. Below formula gives the answer how the list is sorted:
=IF(AND(B1:B22=B2:B23),”Sorted Z-A”,”Not Sorted”))
I don’t know why but the previous formula was cut 🙁
=IF(AND(B1:B22=B2:B23),”Sorted Z-A”,”Not Sorted”))
I came up with this array formula to check both ascending and descending sorts:
{=OR(AND(B2:B7=B3:B8))}
Seems to have cut off the formula
{=OR(AND(B2:B7=B3:B8))}
Nice One Chandoo..Best tip I read till date in 2011.
First I meant {=AND(AND(B2:B7AND(B2:B7>=B3:B8))}
And second {=OR(AND(B2:B7=B3:B8))} doesn’t work with me.
I’m running Excel 2010…
First I meant {=AND(AND(B2:B7) AND(B2:B7>=B3:B8))}
And second {=OR(AND(B2:B7=B3:B8))} doesn’t work with me.
I’m running Excel 2010…
1st new thing I learnt this year…
Use formula below to see the percent of items greater than item above.
i.e. if value in D10 > value in D9 than 1, else 0. Repeat and sum the 1s and 0s.
You can change the > to $D$4:$D$9,1,0))/COUNTA($D$5:$D$10)}
Formula is: {=SUM(IF($D$5:$D$10>$D$4:$D$9,1,0))/COUNTA($D$5:$D$10)}
The best tip I have ever read… Thanks….
Interesting – Thnaks Chandoo.
I am trying to use the Rank function but am getting as #Error because not all of the rows have been scored yet on my template. How do i ignore the error cells?
@Bob: You can suppress the errors by using IFERROR formula. Like,
=IFERROR(RANK(…),””)
If the cells are empty but have something like “N/A” in them, still this method works.
PS: IFERROR works only Excel 2007 or above.
Cool!
Here’s a completely dynamic and non-volatile one for EXcel Tables that won’t be screwed up if someone adds data or puts data above or below the Table:
{=AND(INDEX(Table1[a],2):INDEX(Table1[a],ROWS(Table1[a]))>INDEX(Table1[a],1):INDEX(Table1[a],ROWS(Table1[a])-1))}
Simple and smart trick. Thanks. This came in handy today.
Does anyone know of a way to make this ignore blank rows?
The following didn’t work:
=IF(–(A17:A26″”)*–(A18:A27″”),–(AND(A17:A26<=A18:A27)))
=AND(IF(–(A17:A26″”)*–(A18:A27″”),–(A17:A26<=A18:A27)))
Thanks!
FYI: The following will let it ignore one blank row, and you can nest the IFs to add for more blanks in a row. Ideally it would fill down from last non-blank no matter how many blank rows.
=AND(IF(ISBLANK(A17:A27),A16:A26,A17:A27)<=IF(ISBLANK(A18:A28),A17:A27,A18:A28))