fbpx
Search
Close this search box.

Cool infographics around the web

Share

Facebook
Twitter
LinkedIn

Starting this week I will post cool infographics from around the web, 4-5 of them a week to inspire , to give more ideas on presenting information and to provide some eye candy for awesome readers @ Pointy Haired Dilbert.

Go ahead, click through these awesome graphics:


California Walkability Score Heat Map
california-walkability-score-heat-map-cool-idea

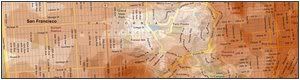
Lee Byron took the Walksocre for california locations and highlighted them on the map to generate this beautiful infographic. [via flowingdata]

Mozilla Firefox vs. Internet Explorer Security Incidents – Cool Square Pie
firefox vs. internet explorer grid pie chart, simple yet effective

This chart is nothing but a square pie chart (or totally defragged partition chart), effective, easy on eye and tells one point as Seth Godin suggested 🙂 [via coolinfographics]

Who owns the land in US?
who owns land in each of the 50 states : land owned by federal government highlighted

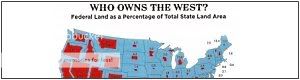
This map shows % of land owned by federal government vs. total land for each state in the US map, pretty cool even though it could be difficult to immediately interpret anything due to varying areas of each state.

Fine to you if your pants sag
fine to you if your butt shows in the saggy pants

This is not entirely a chart, but uses the ideas to tell people how much they will be fined based on their how much their pants sagged. Pretty neat 😀 [via Publication Design]

Visualizing Large Text Data – The trick is in colors
visualizing large text data, colors do the trick

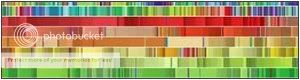
The biggest challenge of the Petabyte Age won’t be storing all that data, it’ll be figuring out how to make sense of it.

well, we are fortunate to have people like Martin Wattenberg who thrive to get the meaning out of all those petabytes. [via FlowingData]

Hope you enjoyed these charts 🙂


Have any neat infographics / charts and want them to featured on this blog?
Drop me a comment or email me at chandoo [dot] d [at] gmail [dot] com.

Facebook
Twitter
LinkedIn

Share this tip with your colleagues

Excel and Power BI tips - Chandoo.org Newsletter

Get FREE Excel + Power BI Tips

Simple, fun and useful emails, once per week.

Learn & be awesome.

Welcome to Chandoo.org

Thank you so much for visiting. My aim is to make you awesome in Excel & Power BI. I do this by sharing videos, tips, examples and downloads on this website. There are more than 1,000 pages with all things Excel, Power BI, Dashboards & VBA here. Go ahead and spend few minutes to be AWESOME.

Read my storyFREE Excel tips book

Excel School made me great at work.
5/5

– Brenda

Excel formula list - 100+ examples and howto guide for you

From simple to complex, there is a formula for every occasion. Check out the list now.

Calendars, invoices, trackers and much more. All free, fun and fantastic.

Advanced Pivot Table tricks

Power Query, Data model, DAX, Filters, Slicers, Conditional formats and beautiful charts. It's all here.

Still on fence about Power BI? In this getting started guide, learn what is Power BI, how to get it and how to create your first report from scratch.

Weighted Average in Excel with Percentage Weights

Weighted Average in Excel [Formulas]

Learn how to calculate weighted averages in excel using formulas. In this article we will learn what a weighted average is and how to Excel’s SUMPRODUCT formula to calculate weighted average / weighted mean.

What is weighted average?

Wikipedia defines weighted average as, “The weighted mean is similar to an arithmetic mean …, where instead of each of the data points contributing equally to the final average, some data points contribute more than others.”

Calculating weighted averages in excel is not straight forward as there is no built-in formula. But we can use SUMPRODUCT formula to easily calculate them. Read on to find out how.

Leave a Reply