
 Transposing rows and columns in a table is one of the most useful tricks when you are pasting data. Yet, it always surprises me that very few people actually know this. So here it is,
To transpose a table of data from rows to columns (or columns to rows)
- Select the table, press CTRL+C
- Goto an empty cell
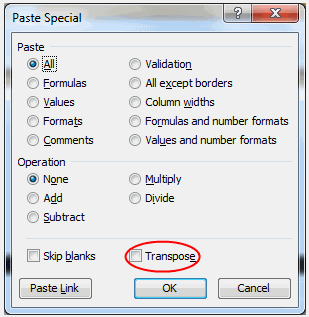
- Right click and select Paste Special (alternatively press ALT+E followed by S)
- Select “Transpose” check box, it is above the OK button.
- Click Ok. Transposed your data is.
I have made a 15 second tutorial on this. See it below:
(Watch the tutorial on youtube, you can also see it in HD)
15 more tips on pasting data in excel | Transpose Charts | More Quick Tips | More Excel Video Tutorials


8 Responses to “Transpose Excel Rows and Columns [Quick Tip + Video]”
Just pressing the underlined letter for each of the Paste Special options will select it. (Some of them will cancel out others, like add or subtract.)
So you can just do:
- Select
- Ctrl-C
- move
- Alt-E, S, E, Enter
And you're done.
A super snappy way to copy a whole tab to values is along similar lines:
- Ctrl-A
- Ctrl-C
- Alt-E, V, Enter
And Boom! You've just copied everything on the current page as a value on top of itself. Useful if you just want to give someone the values, but not the underlying formulae.
Very nice! Your explanation was short and to the point. However, the video was a little too fast.
[...] I cleaned and transposed the data so that area charts can be [...]
Hey, bt wht if u wnt trnasposing using formula?
I mean somtims u hav couple of formulae attachd & u need transposing automatically, then how to do it?
Ever had a big row of formulas that you want to transpose into a column? But if you use the Copy Paste Special Transpose function, all of the formulas adjust in the process unless they are all locked into their cell references. I've found a way to do it, but it isn't very elegant. A more elegant solution would be welcome. Basically, my solution is to covert the formulas to "number" (highlight cells in row, Edit Replace, put equals sign = in "Find what" box, put # in "Replace with" box, then "Replace All"). Then, copy that cell range to the destination, selecting Transpose in the Paste Special box. Finally, replace the # sign with = just like at the beginning. This will convert the "numbers" back to formulas.
Do you have a better method?
Steve
@Steve
Before you copy the cells select them
Do a Search/Replace and replace = with '=
Then do your copy, paste special, transpose
Do a Search/Replace and replace '= with =
[...] Long time Chandoo.org readers already know this. Excel has a built-in feature that lets you transpose data with a single click. [...]
[...] it is a one time process, my friend can use Paste Special > Transpose feature and be done. But this is no one time business. So lets understand which formula helps us do [...]