
It has been a while since we had an Excel Links post. So here we are.
First, I want to update you about our Singapore Workshop.
As you know, we have opened the registrations for this workshop last week. If you are in Singapore and want to attend an Excel & Financial Modeling Workshop, Please consider joining us on July 8- 10. For details & enrollment, visit Singapore Bootcamp page.
Apart from the Singapore workshop, I was busy last week conducting live training at CapGemini, in their Hyderabad office on Excel & Dashboards. It was a very good experience. I learned a lot about practical challenges people face when doing sales reports etc. using Excel.
Due to the training in Hyderabad, I could not write anything last week, but thanks to Hui, who took good care of the blog and wrote some excellent articles on Advanced Excel & VBA (1 & 2)
This week, I am planning to release the Sales Analysis Chart contest results and announce the winner. We have received 80 different charts from 50 people. Lots of variety and creativity.
Here are some Excel links that I recommend. Go ahead and explore these and learn something cool.
Calculating the Clock Face Angles using VBA
Dick at DDoE blog shares an interesting worksheet function & VBA code that would calculate the angle between needles of a clock at any given time. I remember solving similar problems back when I was preparing for MBA entrance exams in India. Go ahead and examine the code (or try to solve it on your own) to have some workout for your grey cells.
Pivot Tables Rock – Song on Youtube
We all know that Pivot Tables rock. They make everything right. But, now there is a song, R&B style. I love the lyrics, especially, “Sittin’ here I got so much data
Gonna take forever so I think I’ll do it later
Calculatin’ all these numbers by hand
Can take a whole afternoon and that sounds pretty bland
Until my friend tells me all about the pivot table
Too good to be true, sounds more like a fable” part. Go ahead and watch it. Have a laugh. And if you want to learn more about Pivot Tables, you know where to go.
Sort Excel Tables by Clicking [VBA]
Robert at Clearly and Simply shows us how to use a bit of VBA to enable click sort on Excel tables. Pretty interesting technique, especially for dashboards and reports.
Adding Horizontal Bands to Excel Charts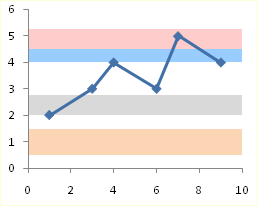
Chart recipe guru, Jon Peltier shows us how to add horizontal bands to Excel Charts. You can use banded charts to indicate performance levels (or any other metric levels). Go ahead and study the technique from Peltier’s blog.
Multi-Column Combo Boxes in Excel
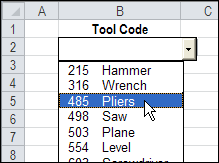 Debra shows us a ridiculously simple way to show multi-column combo boxes in Excel. The trick is to use combo box active-x control with columnCount property set to 2.
The RAWR chart – understanding profits & units sold in phone industry
 Horace writes at Asymco, one of my new favorite blogs, where he analyzes data on Mobile phone industry and presents insightful articles. Recently, he showed a chart called RAWR chart, to depict operating profit per unit & number of units sold by various mobile phone manufacturers. You can see how Apple differs from the rest of the pack in this very simple but powerful chart.
Got a link to share?
If you would like to share a link with us, please drop me an email (chandoo.d @ gmail.com). If you are in to birds, you can tweet me. And if you on facebook, you can share links with our fans on our fan page.


One Response
Last week Google Translate added 5 new languages of the Indian sub-continent: Bengali, Gujarati, Kannada, Tamil, Telugu.
Download a nice Google Translator from my blog:
http://pedrowave.blogspot.com/2011/06/58-languages-translator-in-excel.html