Imagine you are the in-charge of finance department at Hogwarts. So one fine day, while you are practicing the spells, Dumbledore walks in to your office and says, “Our electricity bills are way too high. As the muggles don’t accept wizard money, we have to find a way to reduce our power consumption.”
So you summoned the previous 12 month utility bills to examine energy consumption patterns, and pretty soon you realized that most of the electricity consumption is due to the light bulbs. You suddenly have a brilliant idea. Why not replace the light bulbs with a variety that consumes low power? A light bulb moment indeed.
Your next step is to figure out what varieties of light bulbs are out there. Fortunately this is easier than catching a snitch in a game of quidditch. A quick search revealed that there are 3 types of light bulbs:
- Regular incandescent bulbs (the kind Hogwarts currently uses)
- Compact Fluorescent Light bulbs (CFL)
- Light Emitting Diode bulbs (LED)
Now your job is to do a cost benefit analysis of these options and pick one.

What is cost benefit analysis & how to do it?
Cost benefit analysis, as the name suggests is a process of identifying all the costs & benefits of different decision choices and finding which choice offers maximum benefit for minimum cost.
It is a generic technique and the implementation varies depending on situation, industry and available data.
A typical cost benefit analysis involves these steps:
- Gather all the necessary data
- Calculate costs
- Fixed or one time costs
- Variable costs
- Calculate the benefits
- Compare costs & benefits over a period of time
- Decide which option is best for chosen time period
- Optional: Provide what-if analysis
Let’s conduct cost benefit analysis for our light bulb problem and figure out which option is best.
But first, download the cost benefit analysis workbook
Click here to download the cost benefit analysis workbook. Refer to it as you read this article for best results.
1. Input Data & Assumptions
For each type of bulb we need to find out below information:
Costs:
- Price
- Electricity consumption (watts/hr)
- Life time in hours
Benefits:
- Amount of light (lumens) generated by the bulb
Assumptions:
We also need to assume a few things to keep our cost benefit analysis model realistic & simple.
Some of the assumptions we can go with are,
Global assumptions:
- We need only 1 bulb (doing analysis for n bulbs is just a matter of multiplying 1 bulb results with n)
- Analysis will be conducted in Indian Rupees
- Let’s compare bulbs that give same amount of light (lumens). This means we can ignore the benefit part and focus on costs alone
- This analysis ignores any impact / costs / benefits associated with environmental impact (CO2 emissions, harmful metals like mercury, heat generation etc.)
- Analysis time frame is 5 years.
Other assumptions:
- Average usage of bulb per day is 8 hours.
- Cost of electricity is Rs. 5 per unit (KWH)
- Inflation for electricity cost is 1%
Once we have all the data, tabulate it in Excel like this:

2. Calculate Total Cost of Ownership
Once we have all the necessary data, let’s calculate the total cost of each option (Regular, CFL & LED) over a period of 5 years.
This step involves calculating both fixed & variable costs.
Fixed or one time costs:
The fixed cost for each light bulb type is nothing but the price.
But wait… what about the life time of bulb?
Since each type of bulb has certain life time, we will have to pay for replacement of bulbs too.
This means, apart from fixed cost at the start of time period, we will also have a variable cost that depends on the life time of bulb type.
Variable costs:
There are 2 variable costs in our analysis.
- Electricity consumption cost
- Bulb replacement cost
Electricity consumption cost:
This is calculated by below formula:
Wattage per month / 1000 * Inflated unit cost
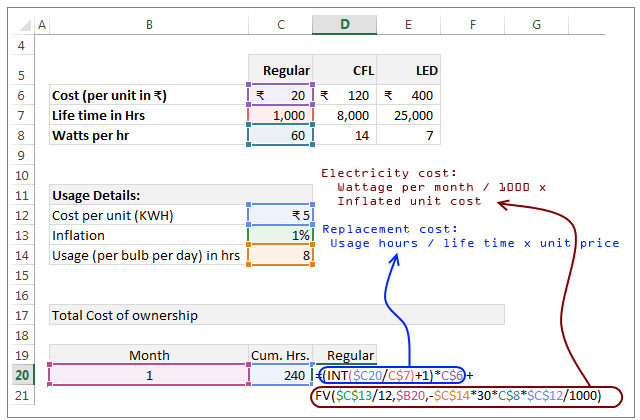
The actual Excel formula looks like this:
FV($C$13/12,$B20,-$C$14*30*C$8*$C$12/1000)
How this formula works?
To understand this formula, first imagine what the total unit cost should be at the end of Month x.
For first month, the cost is =total monthly usage in hours * watts per hour / 1000 * unit cost * (1 + inflation/12)^1
For second month, the cost is same as above, but the exponent in the end becomes 2.
Let’s say, the blue part of the formula is denoted by something.
Then, the cost at the end of Month X will be,
=something * ( (1+inflation/12)^1 + (1+inflation/12)^2 + … + (1+inflation/12)^X )
Oh, all this math is confusing… Isn’t there a simple spell to answer this?
I am glad you asked. There is a spell to get this answer in one shot. It is called as FV()
The FV formula calculates sum of above series.
We simply write
= -FV(inflation/12, month number, total monthly usage in hours * watts per hour / 1000 * unit cost)
to get the answer we want.
Why the minus sign in front of FV?
This is because, by default FV returns values in negative. It has got something to do with how banks always take money from us, but are very reluctant to give back or like that.
Bulb replacement cost:
The unit cost formula felt like trying to catch a snitch while riding a broomstick upside down. Thankfully, the bulb replacement cost formula feels like sitting in the crowd, cheering match while eating chocolate frogs.
The calculation for bulb replacement goes like this:
Cumulative usage in hours / life time of the bulb * unit price of bulb
Here is the formula for this:
(INT(cumulative usage/ life time of the bulb)+1)*unit price of bulb
Why use INT(…) + 1
Let’s say the life time is 1,000 hrs, cost is Rs 20 and we use 240 hrs in first month. Our cost is still Rs. 20, not 24% of 20.
Likewise, at the end of 5th month, our total usage would be 1200 hrs (240 x 5 = 1200) and we must buy a new bulb as the life time is only 1000 hrs.
The replacement cost is not uniformly spread across months (or hours). It happens once at beginning and then recurs once per lifetime of the bulb.
Hence we use INT to round the cumulative usage / life time to the integer portion (ex: INT(240/1000) will be 0) and add 1 to it as there is initial cost.
Explanation of these formulas in our spreadsheet
Look at below illustration to understand how these formulas look in the cost benefit analysis worksheet.

3. Calculate benefits
This part is not required for our problem as the benefits are same for all 3 types of bulbs. You can use logic similar to cost calculation when the benefits vary. For example if you want to do cost benefit analysis of 3 types of investment choices – mutual funds, stocks, bank deposits, then you can use below framework:
Costs:
- Brokerage costs
- Entry costs
- Operating expenses
- Exit costs
- Volatility / risk factors
Benefits:
- Return of the investment
- Liquidity benefit
4. Compare costs & benefits over a period of time
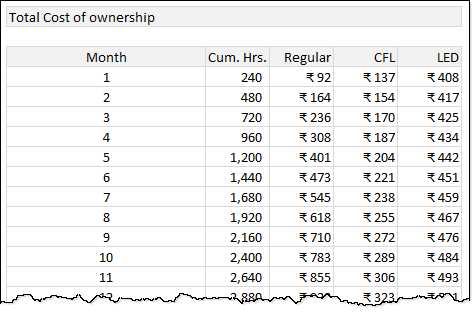
Once we have these cost & benefit calculations ready, we need to calculate them for 60 months (5 years) for all 3 types of bulbs.
The resultant table looks something like this:

5. Decide the winner
Once we have all the numbers, it is just a matter of picking the winner. If you are comparing costs, pick the lowest cost item. If you are comparing benefits, pick the item that offers most benefit / cost ratio.
How to convince your boss about the decision?
While it is easy to decide which option is the winner by just looking at numbers, when you take this proposal back to Dumbledore, he may want a little more explanation. This is where a visualization of cost benefit analysis can help.
Example – Visualization of Cost benefit analysis
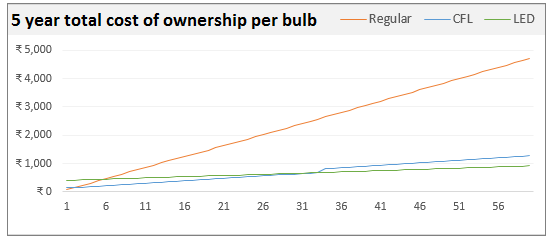
Here is a completed visualization of our light bulb cost benefit analysis.

How to create this chart?
Simple, just follow below steps.
- Select the total cost of ownership table that you calculated
- Insert a new line chart
- Format the chart as per your (or your boss’) taste
- Done
Things to keep in mind:
- Go with line charts if your analysis is against a time period or similar
- Go with column / bar charts if you are comparing various options with one time costs only
- Format the chart so that it is easy to identify winning choice at each point of time.
Adding what-if analysis
What if analysis is a great way give power to your decision makers. When you prepare a cost benefit analysis model like above, you will always hear questions like:
- So what would be the total cost for using 12 CFL bulbs 16 hours per day for next 25 years?
- In above case, how much would we save if we switch to LED bulbs?
- What would be the cost for 30 years? 10 hours a day? 20 bulbs?
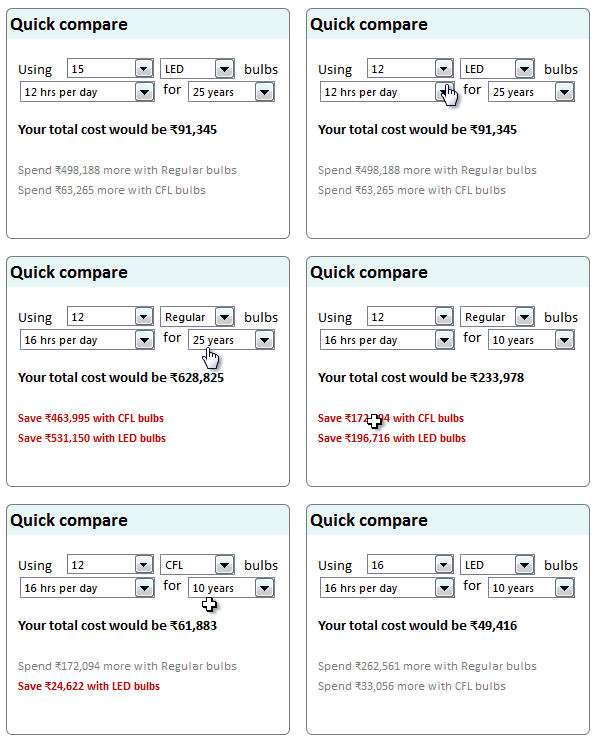
Thanks to powerful Excel form control feature, you can easily add a comprehensive what-if analysis tool to your model.
Like this:

Process for adding what-if analysis
Follow below process for including what-if analysis in your spreadsheet models.
- Identify all possible scenarios for which what-if analysis may be required.
- Determine the variables (in our case, the variables are number of bulbs, bulb type, usage in hours & years)
- Figure out what output should be displayed (in our case, the output is total cost and a comparison with other bulb types)
- Set up an input area where user can select any combination of variables
- Use form controls, slicers, data validation, VBA or simple input cells for gathering this data
Tip: click on those linked words to understand how to set them up - Write formulas that link to the user input cells / form controls
- Display the output (text, charts etc.)
Please examine the download workbook for actual implementation of this.
Guidelines for creating better analysis models
Whenever you are analyzing something like this, please follow below guiding principles for awesome results.
- Do your research first: Identify all factors, inputs, assumptions & facts that impact the decisions. Spend sometime researching before jumping in to Excel.
- Set up separate areas of input, analysis & output: Create separate areas in your workbook to handle inputs, calculations & outputs (such as charts, text). Clearly demarcate them by using different styles or headers for each section.
- Avoid analysis paralysis: Keep your analysis workbooks simple & realistic. Don’t over complicate them with too many inputs or too much calculation. If a certain factor is irrelevant or too complicated to consider for your analysis, ignore it. Example: in our analysis we ignored benefits as they are same for all 3 options. We also ignore environmental impact as it is tricky to calculate.
- Use consistent formulas: Write your formulas in such a way that same pattern is repeated many times. This way you can write once and use the power of relative & absolute references in Excel to fill the formulas everywhere.
- Let users play with your model: Include what-if analysis or form control based interaction in your workbooks so that your users can play with the model and get answers for their questions.
- Visual explanations: Visual explanations like charts, dashboards are very powerful & memorable. So depict your results visually as much as possible. Remember the old adage, a picture is worth thousand words.
Related: Spreadsheet modeling best practices for analysts
Download Cost Benefit Analysis workbook
Please click here to download cost benefit analysis workbook. Examine the calculations & form controls to learn more.
Cost benefit analysis – your experiences please…
Cost benefit analysis was a big part of my work when I worked as an analyst. Now I am in the role of a CEO and it is even more relevant for me. For most situations I create a simple Excel model to examine the costs & benefits to decide the winner.
What about you? How do you analyze costs vs benefits? What techniques do you use? Please share your stories, examples & tips in the comments section.
Want more? Introducing 50 ways to analyze data course
If you like to learn how to analyze data, gather insights, prepare outputs & interpret results, then you will love my new course – 50 ways to analyze data.
The above example is lesson number 24 in our course. Each of the 50 lessons deal with common business analysis situations, case studies & techniques so that you can become the analytical wizard you always wanted to.
This course is now open.
If you want to know more about it, please click here.


21 Responses to “Doing Cost Benefit Analysis in Excel – a case study”
It shows my address is already subscribed. Am I listed in the mail list?
Truly magnificent.
Hello Chandoo,
Great post to become awesome.
Just a minor matter. Please check the units of Power, it is "Watt" not "Watts per hour". If a 60 Watt bulb is used for an hour it uses 60 Watthour(= 60 Wh) of energy, divided by 1000 this gives 0.06 kWh.
I know this is not a site for physics, and is has no impact for the end results, but it may confuse some of your readers and blur a for the rest good example.
I love your site!
Regards,
Hardy
Very good model Chandoo, simple and to the point.
Just to help improve the input process in an evaluation.
Be doubly careful if your decision depends too much on assets / articles lifetime.
As an example: advertised bulb CFL lifetime is 8000 hr. But this only happens at the Lab and only if you turn on the bulb once per day.
Reality is that in many locations, electricity voltage & power is variable, and bulbs are turned on more often increasing the probability of burning. So the real lifetime of bulbs are not too different between the options.
Regards
Carlos
Good post but missing very important issue. LEDs deteriorate with time, so just after 5k hrs usually the LED is capable of 50-60% of initial Lumens. Quite a drastic drop.
As for the lifetime both CFL and LED lights (the mainstrem ones) lifecycle is around 6-8k hrs. And in places where lights is often switched on/off the lifetime of CFL/LED drops to 3-4k hrs.
Hi Chandoo. Interesting analysis as always. I especially liked your what-if tool.
Another way to think about multi-year cost/benefit is from a discounted cash flow perspective. Using your example I would use the Incandescent bulb as the base line and calculate the differential cash flows for the two alternatives. Period zero would be an incremental investment (cash out) of 100 for the CFL and 380 for the LED. Benefits (cash in) would be each period's cost savings for each alternative comparing their costs to the Incandescent's (including any additional bulb purchases). You could then use these cash flow estimates to calculate simple Payback but I would discount the cash flow streams (excluding initial cash outlay) using the business's Weighted Average Cost of Capital (WACC) or Hurdle Rate and Excel's NPV or IRR functions. Subtract out that initial cash outlay and the result would suggest that, all other factors being equal, the highest NPV (or IRR) is the best alternative. A negative NPV, or an IRR less than the discount rate, would suggest the Incandescent is the better alternative. The benefit of this approach is that it considers the always important time value of money.
One final thought, I would do this type analysis with annual data. The monthly nuances aren't worth the trouble - especially when you are forecasting the future.
Hi Bob. I like your approach. Do you think you could adjust Chandoo's spreadsheet to match your idea?
Sure. But I am not sure how to post a sample workbook here.
@Bob
You can't attach a file here
Ask the question in the Chandoo.org Forums
http://chandoo.org/forum/
Where you can attach a file
Hi Chandoo. I am always geeking out on this website. I agree with Bob. I think an important aspect of time value of money is being lost here. the expensive upfront cost of the LED typically outweighs the low cost of energy. I think long run though this model indicates that LED's reign supreme in a childless home that is. As always keep up the good work. 🙂
Two other points I neglected to include in my earlier post.
First, NPV and/or IRR calculations should use risk adjusted cash flows. With any cost/benefit forecast there is some degree of risk. (As someone once said, forecasting is difficult, especially about the future.) For example, if because of the CFL lifetime risk noted by Carlos, and the LED lumen output risk pointed out by ChrisAd, you estimate the probability of achieving the incremental cash flow benefits of these alternatives is only 60%. For the NPV calculation you would then use only 60% of the originally calculated benefits -- a 100 Rupee cash benefit becomes 60 for NPV purposes.
Secondly, somehow I forgot the always present tax authorities. NPV/IRR costs (if expense, not capex) and benefits should be after tax. Depending on your country and your tax situation your 60 Rupees may become 40.
So if you adjust your cash flow stream for risk and taxes you are good to go. Sorry I forgot these two important factors in my initial comment.
[…] Chandoo has a light bulb moment, while setting up a cost benefit analysis. […]
Hi Chandoo. There is a unique flaw in your model specifically related the cost effectiveness of light bulb technologies. The flaw has nothing to do with the challenges indicated by the other commenters. It also comes with a fun story.
It was spring break for my two young children. We visited a local science and technology museum where we live. I first identified the flaw watching my children play with one of the hands-on exhibits. The exhibit was a small bicycle connected to a generator. The generator is connected to three light bulbs, regular, CFL, and LED. As you pedal the bike the lightbulbs illuminate. Light pedaling illuminates only the LED. Very aggressive pedaling illuminates all three bulbs. The purpose of the exhibit is to show children how much extra energy is required to power regular lightbulbs. Simple enough in a very linear world.
The flaw I identified, then validated with the museum staff, is the math is completely linear. Meaning the math favors LED technology assuming 100% of the light is required 100% of the time, in the same room, and assumes the light is either on or off.
1) Buildings tend to have multiple rooms, which have different lighting requirements. Think about your house.
The lights over the vanity mirror in your bathroom may only require 1 x LED in terms of total lumens however may require multiple bulbs to eliminate shadows while applying makeup. Which takes a short amount of time, then the lights are turned off for much of the day. The cost of LED may be too high based on the short amount to time the lights are in use.
Lamps in your living room may have a 3-way switch that progressively increases the lumens, requiring a special bulb.
Your back porch may require a high power bulb that shines brightly over a large area.
In these cases you need to identify the bulb technology that meets the "art" side of the equation before applying the "science" part. When done correctly you will identify a mix a build technologies that meet your overall requirements.
2) CFL and other specialized bulb technologies cannot be used with a dimmer switch. Only a traditional on-off switch. The ceiling light in my kids bedrooms are connected to a dimmer switch, allowing me to progressively change the lumens up or down depending on need and time-of-day. That barrier eliminates some bulb technologies from the equation for those rooms.
Net/net, in a linear world we would always choose LED technology. However, the more accurate analysis is to treat each room as it's own cost analysis based on your lighting requirements and use case.
[…] http://chandoo.org/wp/2015/01/28/cost-benefit-analysis-in-excel/ […]
The crux of the matter in this lesson is to learn how to use some Excel tools and techniques for analysis. The choice of light bulbs is only an example, which appears to be subject of many controversies. However, the numeric data associated with this example are pretty good for the learning purpose of Excel techniques.
Excellent work Chandoo.
Hi Chandoo,
I’m shy about asking, but if I buy 20 LED bulbs at 400 rupee each, then wouldn’t the first year cost for an LED bulb be at least 8,000 for cost of bulbs (not including the energy cost)? The Quick Compare says the total cost would be 6,088 (16hrs/day). If I’m buying bulbs, I would like to know the upfront cost. Maybe I’m missing something in this cost-benefit. I enjoy your blog very much.
Hi Chandoo,
would like to know if the course would include supply chain analysis and modeling etc. If not, will you consider adding them or conduct a separate course on this?
am particular interested to know more on this aspect.
Rgds,
Jason
Hi Chandoo,
Thank you very much for sharing your experience and knowledge here! It became very useful discussion. Thanks to all guys who shared their opinions and different solutions as well.
The article is EXCELENT and full of professionalism! A real example how excel can help you doing real solutions.
Mariya
For this, I had been using this and it's great.
It has instructions which can help you.
They also have live support and forum to help you anytime.
Hi Chandoo, I am a big fan of your dashboards and reports, i take lot of ideas from it to build my project management dashboards. Regarding Benefits Analysis, could you please help provide information in details on how to calculate benefits realization for 5 years for a IT Software development project? it can be both tangible and intangible benefits
Complete explanation but concise. Thanks