
Finally the winner for our first visualization contest is decided. It is… Cuboo.
The entry by MB (#6) came a close second.
All the participants will receive a copy of my excel formulas e-book while Cuboo gets a copy of The Visual Display of Quantitative Information by Edward Tufte.
All in all there are several great entries suggesting a good variety to present budget vs. actual performance. Go check them out.
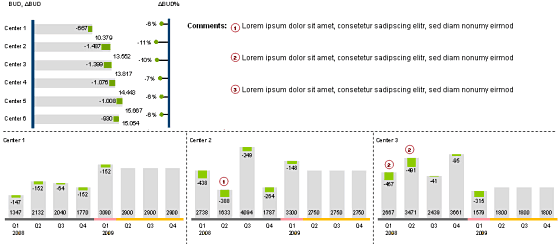
A Month ago I got a request from a reader asking me what is the best way to visualize budget vs. actual performance? I didn’t have any ready made answer for him. So I posted a visualization challenge, inviting contributions from my readers.
I got several responses and I am still not sure which one of them is best. So I have asked you to vote for the best visualization among all. And you selected Cuboo as the winner. Congratulations!
Many thanks to all my readers and contributors for making this a memorable and learning experience. I have learned several fun and interesting charting tricks looking the contest entries. I hope you had similar experience.
Have a Charting Problem and need some help?
Write to PHD by posting a comment or e-mail me at chandoo.d @ gmail.com. I a bit sloppy on emails these days, but I always star your mails and revisit them during weekends and send a response. So…


