Its what happens when you have to write a lot of vlookup formulas before you can start analyzing your data. Every day, millions of analysts and managers enter VLOOKUP hell and suffer. They connect table 1 with table 2 so that all the data needed for making that pivot report is on one place. If you are one of those, then you are going to love Excel’s data model & relationships feature.
In simple words, this feature helps you connect one set of data with another set of data so that you can create combined pivot reports.
Practical Example – V(X)LOOKUP hell vs. Data Model heaven
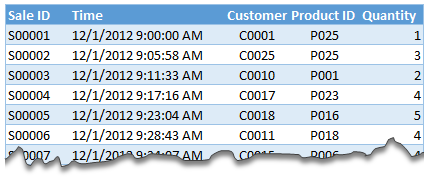
Lets say you are looking sales data for your company. You have transaction data like below.
And you want to find out how many units you are selling by product category and customer’s gender.
Unfortunately, you only have product ID & customer ID.
With VLOOKUP Hell,
You first fetch all the customer and product data and place them in separate ranges.
Then write a vlookup formula to fetch product category, another to fetch customer gender.
Then fill down the formulas for entire list of transactions.
Now make a pivot table.
Assuming you have 30,000 transactions, you have to write 60,000 VLOOKUP formulas to create this one report!!!
With Data Model heaven,
Create relationships between Sales, Products & Customer tables
Create a pivot table
Creating a relationship in Excel – Step by Step tutorial
First set up your data as tables. To create a table, select any cell in range and press CTRL+T. Specify a name for your table from design tab. Read introduction to Excel tables to understand more.
Now, go to data ribbon & click on relationships button.
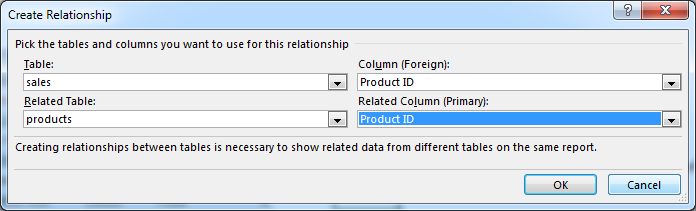
Click New to create a new relationship.
Select Source table & column name. Map it to target table & column name. It does not matter which order you use here. Excel is smart enough to adjust the relationship.
Add more relationships as needed.
Using relationships in Pivot reports & analysis
Select any table and insert a pivot table (Insert > Pivot table, more on Pivot tables).
Make sure you check the “Add this data to data model” check box.
In your pivot table field list, check “ALL” instead of “ACTIVE” to see all table names.
Select fields from various tables to create a combined pivot report or pivot chart
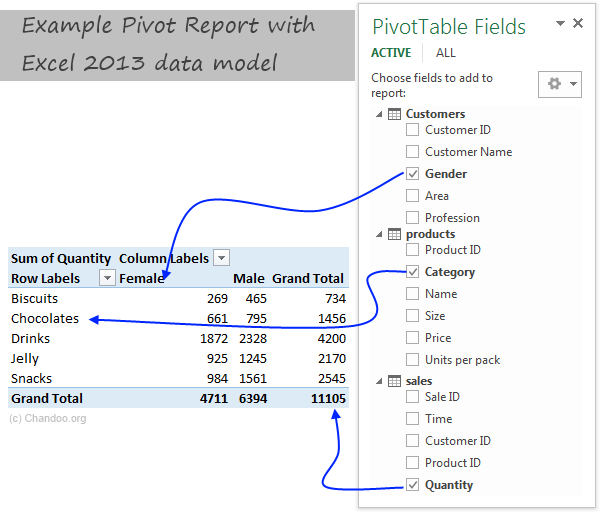
Example: Category & Gender Sales Report
Add category to row labels
Add gender to column labels
Add quantity to values
and your report is ready!
Things to keep in mind when you using relationships
Same data types in both columns: Columns that you are connecting in both tables should have same data type (ie both numbers or dates or text etc.)
One to one or One to many relationships only: Excel 2013 supports only one to many or one to one relationships. That means one of the tables must have no duplicate values on the column you are linking to. (for example products table should not have duplicate product IDs).
You can add slicers too: You can slice these pivot tables on any field you want (just like normal pivot tables). For example, you can further slice the above report on customer’s profession or product’s SKU size.
Benefits of Data Model based Pivot Tables
Once you have a data model in spreadsheet, you will enjoy several benefits (apart from multi-table pivots that is). They are,
Distinct counts: This simple but often tricky to calculate number is easy to get once you have data model based pivot. Just go to value field settings and change the summary type to “Distinct count”. Here is a tip explaining how to get distinct counts in Excel pivots.
Measures & DAX: Once you have a Data Model, you can unleash the full Power Pivot features on your workbook. You can create measures (using DAX language) and calculate things that are otherwise impossible with regular Excel. Here is an example of percentage of something calculation with DAX & Data Model, to get started.
Pivots from data in other files & databases: You can combine data model with the abilities of Power Query to create pivots from data in other places. For example, you can make a pivot from sales data in SAP with customer data in CRM system. Here is an overview of what is Power Query?
Convert Pivot Tables to formulas: Once you have a data model based pivot table, you can turn it in to a set of formulas. You can access this feature from “Analyze” ribbon. This will replace your pivot with a bunch of CUBE formulas. Here is an overview of CUBE formulas.
Drawbacks of Data Model:
Of course, its not all cup cakes and coffee with Data Model. There are a few drawbacks of data model based pivot tables.
Compatibility: Data model & relationship feature is available only in Excel 2013 or above. This means, you cannot create or share such pivot reports with people using older versions of Excel.
Not able to group data: In regular Pivot Tables, you can group numeric, data or text fields. But with data model pivot tables, you can no longer group data. You must create another table with the group mapping and use it as a relationship.
Ever since discovering PowerPivot, I kind of stopped using VLOOKUP (or XLOOKUP) for most of my own analysis. Now that relationships are part of main Excel functionality, I am using them even more.
What about you? Are you using relationships & data model in Excel? What cool things are you doing with it? Share your tips with us using comments.
Want even more? Try PowerPivot
If you want even more out of your reports, then try PowerPivot. It is a new feature in Excel 2013 (available as add-in in Excel 2010) that can let you do lots of powerful analysis on massive amounts of data. Here is an introduction to PowerPivot.
Thank you so much for visiting. My aim is to make you awesome in Excel & Power BI. I do this by sharing videos, tips, examples and downloads on this website. There are more than 1,000 pages with all things Excel, Power BI, Dashboards & VBA here. Go ahead and spend few minutes to be AWESOME.
Read my story • FREE Excel tips book
Let’s try something different. I will share a data analytics challenge here. Post your solutions in the comments. Our first challenge involves Employee Data Analysis.
Can someone tell me what =countif(sales[date],sales[date]) is counting? The value is 19. Its found in the =SUMPRODUCT(IF(sales[SELLER]=H12,1/COUNTIFS(sales[SELLER],H12,sales[date],sales[date]),0))


11 Responses to “Who is the most consistent seller? [BYOD]”
The Date column in the sample file is Text not Dates
[…] http://chandoo.org/wp/2015/02/18/calculating-consistency-in-excel/?utm_source=feedburner&utm_med… […]
Great Chandoo. Keep it up, Looking forward more from BYOD..
Thanks
With Excel 2013 the pivot table could be connected to the data model which provides a distinct count.
This will do for invoice count
=COUNTIF(F:F,H12)
Instead of
=COUNTIFS(sales[SELLER],$H12)
Excellent document. How did you make the last graphic? Witch app. Thanks for answer.
Can someone tell me what =countif(sales[date],sales[date]) is counting? The value is 19. Its found in the =SUMPRODUCT(IF(sales[SELLER]=H12,1/COUNTIFS(sales[SELLER],H12,sales[date],sales[date]),0))
Hi Chris,
=countif(sales [date],sales[date]) function is counting the unique dates in the table.
Vândalo
Excellent document!
Can you explain more about the calculation on Weighted consistency? More specific the small number is 0,00001 ?
How come the number should be smaller if there is more sellers?
Hi,
Not understood this formula: {=SUMPRODUCT(IF(sales[SELLER]=H12,1/COUNTIFS(sales[SELLER],H12,sales[date],sales[date]),0))}
Please explain.
Thanks.