Introduction to DAX Formulas & Measures for Power Pivot
Power Pivot - 23 comments
Last week, you saw an Introduction to Power Pivot for Excel. Today, lets talk about DAX formulas & measures for Power Pivot.
What is a Measure?
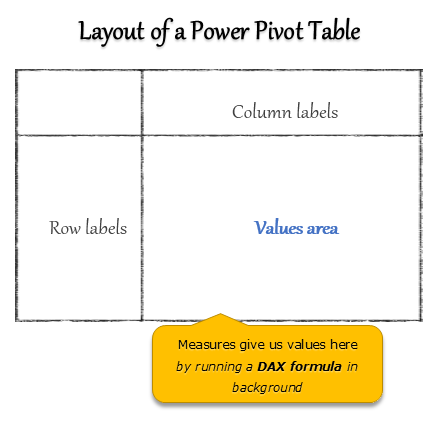
A measure is a formula for the values area of Power Pivot table.
A measure can be implicit or explicit.
Implicit measures are created automatically when you drag and drop a field in to Power Pivot values area. For example, in last week’s introduction, we created an implicit measure for SUM of Sales by dragging and dropping the sales amount field in to values area of our power pivot table.
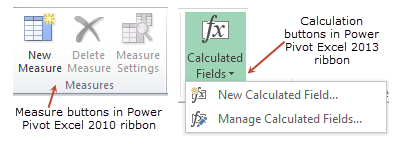
Explicit measures are created by you using New measure button in Power Pivot tab (or Calculated Field button in Excel 2013 Power Pivot tab). You can also create a measure in the Power Pivot window.
Measures vs. Calculated Fields
They both refer to the same thing in the context of Power Pivot. Up to Excel 2010 Power Pivot versions, Microsoft used Measure as the official term.
Starting Excel 2013, Measures became Calculated Fields.
So what is DAX then?
DAX stands for Data Analysis Expression. It is a special language we use to create measures in Power Pivot. Although it is a special language, it looks exactly like our regular Excel formulas. That means you can easily learn the DAX basics and create measures in no time.
Think of DAX as Excel Formula ++. An upgraded version of Excel formulas that can handle power pivot data and give you the calculations you want.
Lets create a measure
Step 1: Decide what the measure should do
The first step is to figure out the need for a measure. Lets say we want a measure to sum up total sales.
Step 2: Launch New Measure screen
In Excel 2010: Power Pivot Ribbon > New Measure
In Excel 2013: Power Pivot Ribbon > Calculation Field > New Calculation Field
This will open below screen (screenshot for Excel 2013 shown below. Excel 2010 looks almost similar).
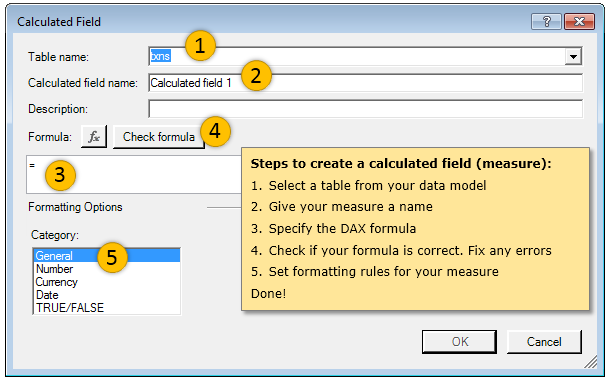
Step 3: Give our measure a name
Lets call it Total Amount
Step 4: Write the DAX formula
The formula for summing sales is =SUM(sales[sale amount])
This formula looks exactly like an Excel formula!!!
As I mentioned before, the syntax, look & fell of DAX is just like Excel formulas. It is DAX’s power, flexibility & variety that outsmarts Excel formulas.
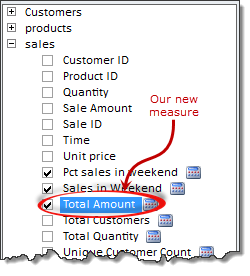
When you press OK, a new measure (Total Amount) will be created and attached to the Sales table in your power pivot data model. It looks like this,
Step 5: Add this measure to your Power Pivot report
Just drag and drop this measure in to values area of your pivot report. Instantly total sales amount will be calculated based on your report set up.
Why bother creating a measure for such simple thing as SUM?
I know you would be asking this. It seems like a lot of trouble to create a measure, to just show the sum of sales amount. Well, SUM & COUNT are just tip of the DAX iceberg. The power of DAX formula engine is truly phenomenal. To prove it, lets play a small game.
Imagine how much time you would take to write a regular Excel formula or setting up a regular Pivot report to answer each of these questions:
- Count of distinct customers by region & Product category for month of May 2012
- Sum of sales made in weekends only by customer gender & product size for Q1, 2012
- Percentage of sales made in weekends (compared to total sales) by customer name
- Number of customers during lunch hours (between 12noon & 1:30 PM) by week day
Now, how would you feel if I tell you that using DAX, it will take less than 5 minutes to answer all these questions. 5 minutes!!!
And the beauty is, once we have a measure that tells us sales made in weekends, we can use it in any report:
- Sales in weekends by gender & product size – YES
- Sales in weekends by product category & month – YES
- Sales in weekends by year & season – YES
All without any additional work!
Oh this is so tempting, teach me how, teach me now
Don’t worry. I am not going to leave you high & dry. I made a video (30 mins) explaining below topics:
- Introduction to DAX, measures & calculated fields
- Implicit vs. Explicit measures
- Creating a simple DAX measure
- Example DAX measures & explanation:
- Sum of sales
- Count of distinct customers
- Sales made in weekend
- Percentage of sales made in weekend
How can I learn more?
If all this sounds interesting, you would enjoy our upcoming online course on Power Pivot. If you want to know more about our class, please enter your name & email below. I will also send you 2 videos on Power Pivot.
[Click here in case you are not able to see the sign-up form.]
Do you DAX? Share your tips & experiences
It took me a while to wrap my head around the way DAX formulas work. I am still learning and struggling to come up with measures for every thing. But I find them very powerful & addictive. I am now able to create powerful analysis reports & dashboards for my clients, thanks to DAX formulas and Power Pivot.
What about you? Do you play with DAX often? What is your experience like? Please share your ideas, tips & suggestions in comments.

Hello Awesome...
My name is Chandoo. Thanks for dropping by. My mission is to make you awesome in Excel & your work. I live in Wellington, New Zealand. When I am not F9ing my formulas, I cycle, cook or play lego with my kids. Know more about me.
I hope you enjoyed this article. Visit Excel for Beginner or Advanced Excel pages to learn more or join my online video class to master Excel.
Thank you and see you around.
Related articles:
|
Leave a Reply
| « Can you calculate vacation days in a period? [Homework] | Details about our Power Pivot Course [and a video for those of you not interested] » |
 At Chandoo.org, I have one goal, "to make you awesome in Excel & Power BI". I started this website in 2007 and today it has 1,000+ articles and tutorials on data analysis, visualization, reporting and automation using Excel and Power BI.

23 Responses to “Introduction to DAX Formulas & Measures for Power Pivot”
Thanks for sharing your 2nd post on PowerPivot,
Please can you share Video link other than Youtube. Thanks
**As is it still blocked in Pakistan
@Rahim... You are welcome. The video is not on youtube. You will be able to see it once you confirm your email address here: http://chandoo.org/wp/resources/learn-power-pivot-for-excel/
Thanks ! 🙂
Hi Chandoo,
Thank you for sharing such a useful information and it really help me to upgrade my skills. I watch your measures and Dax video on your, but unable to access this video. can you please give me access to view it.
Apart from this I want to join the course as well.
My Question related to video:
If we have to calculate "Sales in Weekend" column in rolling months. Does the DAX Formula will work for all the months correctly ? How ?
Do we have to always find out when the first Monday comes in a particular month ? Example our database has months from Jul to Dec 2013.
I hope I have written my questions well to have your answers. Thanks in Advance. Looking forward to it and your course. But would be more happy If we (Visitors) can get 1 or 2 more lessons of PowerPivot on your Blog. 🙂
Thanks again
I'm loving the PowerPivot information! Question though, we don't use Sharepoint at my work - is there any other way to share a PowerPivot workbook?
Mr. Chandoo,
I Request you please add given below topic in Power Pivot course.
1. How to Handle Many to Many Relationship
2. Non Additive and Semi Additive Calculation
3. How to make Asymmatire Reports using Power Pivot
4. How to handle Banding Ranges Slab(0-10,11-15 etc)
5. Ratio and Percentage.
Regards,
Rajeev Gautam
[...] Introduction to DAX Formulas & Measures for Power Pivot [...]
[...] Chandoo.org on DAX Formulas and PowerPivot [...]
Hi,
I am trying to view the DAX formula video and I have already signed up for the course. Everytime I try to view the video I get the sign up screen.
TIA
I need help. I have Tasks listed in the column labels quadrant in excel 2010, a date in the row label and values in the values quadrant. I created a new measure to average some time values for each of the 2 tasks. Now I want to create a mesaure to average the 2 averages. Both columns are labled the same thing "Avg Time (Minutes)". How do I get an average of those two columns when they are titled the same thing because of how it was done? Can I do a new measure and put in column names like a basic excel function (i.e. =Average(I8,J8)? Thanks!
I am trying to view "Introduction to Measures & DAX" video, after I signup with my email, all I get is the course sign-up screen!
Please help!
Jacob
I've been trying to find the "Calculated Item" functionality of the conventional Pivot Table on the PowerPivot options and measures. But I haven't found any so far.
Does someone here has a hint about it?
Hi have you found a way to solve it? im also suffered from that PowerPivot with it you cant use the calculated item function which is quite powerful in excel pivot. pls help.
Estoy incursionando en el Power Pivot y quisiera saber cómo agrupo las fechas por ejemplo?. Gracias de antemano.
[Google translate] I'm dabbling in Power Pivot and let me know how I group the dates for example ?. Thanks in advance.
Hi there everyone, it's my first pay a quick visit at this web page, and
piece of writing is genuinely fruitful in support of me, keep up
posting these types of content.
Hi Chandoo,
I am trying to find return on investment when money have been invested at irregular time.
So let's say that my initial investment was £100 for a fund and that grew to £x by a certain date, I then add more money at a later date to the same fund and at a later date I add more money to the same fund.
The unit price of the fund is say £Y at new dd/mm/yy so I know total value of my fund at any point but how do I work out return on my investment.
Hope my question make sense.
Many thanks
Satish
@Satish... you can use XIRR() to get rate of return from irregular cash flows. Set up your data like this and you are good to go:

Hey there I am so glad I found your website, I really found you by error, while I was researching on Aol for something else,
Anyhow I am here now and would just like to say thanks
for a marvelous post and a all round interesting blog (I
also love the theme/design), I don’t have time to browse it all at the moment but I have bookmarked it and also included your RSS feeds, so when I have time I will be back to read more, Please do keep up the fantastic work.
I cannot sign up. I have been trying to request to see the video so i entered my name and email but it says i am not in the mailing list.
Hi Chandoo,
I enjoy your blog. I tried watching the video, but was not able to. It says the mailing list is not active.
Thank you!!
Mila
hi, when i fallow the link to "Learn Power Pivot for Excel" this error is appeared "Mailing List Not Active"
what I have to do?
The problem is " how to build a hundred measures" i was told to install Dax studio, but unluckily I find it cant not updates my changes in the edit zone back to Powerpivot. as i search further it shows more of powerBI, i dont really need that. is there a efficient way to solve this problem, which supposed to be very commenly encountered by users.