
Every week PHD features 5 of the most beautiful and awesome visualizations seen on the web for your inspiration and amusement. These charts explore and present data in creative ways and provide new ideas. Browse past visualizations for inspiration and fun.
Scientists Scan Images from Brain

How cool it would be if you can download your thoughts and imaginations from mind to your desktop ? How beautiful it would be. Scientists in Japan have found a mechanism to map images in mind.
How a machine thinks about chess moves?
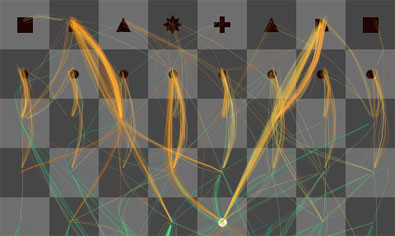
We all know about computer programs that can play chess, now you can see how the program thinks about each of the moves and their outcome. See the thinking machine in action by clicking the above link. [via Cool Infographics]
Flowcharts explained through flow chart
XKCD is one of my favorite sites. In this flow chart they explain a flow chart.. Very recursive and pure fun.
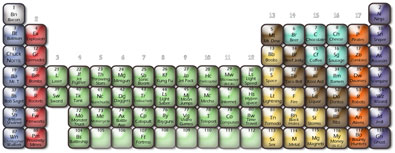
Periodic table of awesoments is a fun visualization of various awesome stuff in our life like ninjas (N) and coffee (Cf)
Visualizing music – awesome stuff
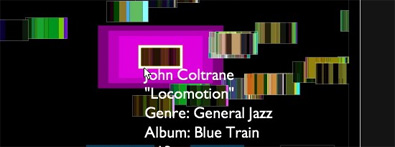
Most of us would have seen the music visualizations through winamp, but the one featured above is totally mind blowing as it takes meta data and various song attributes in to consideration for showing the visualization.
Got a tip or idea for me? Share it through comments. You have a great weekend 🙂


4 Responses
Arggh! Another periodic table of X. Obviously some thought went into this one, but I’ve yet to see one that satisfactorily embodies the functionality and organization of the one where X = elements.
Hey Chandoo
I mailed you a while back regarding some help in CAT, not sure if u got the mail so thought of checking back.
Mail was in regards to one of your posts on CAT.
Can you please let me know if u got the mail and busy or u havn.t got the mail at all.
Thanks much
Deepika
@Jon: This one is better. Replicating periodic tables success is very difficult as there is no other data that matches the pattern or attributes. Did you check the periodic table of visualizations ? http://www.visual-literacy.org/periodic_table/periodic_table.html
@Deepika: Thanks for reminder. I am sorry for the delay in response. I will be sending a reply tonight / tomorrow. Your mail was buried in the heap of unanswered stuff while I was waiting for internet connection.
Chandoo –
As I said, some thought went into this PT of X. I liked Group 2 (IIA) as well as the faux metalloids, the IIIA-VIA metals, and the Rare Earths. The rest seemed to be a struggle to think of enough other elements to fill the TMs, Halides, Halogens, and Noble Gases. Perhaps I don’t share enough obscure obsessions with the author.
The PT of Visualization Methods is actually the one that led me to despise the genre. First of all, it’s about visualization, but it doesn’t even look appealing. I have to force myself to read more than three elements’ worth. Unlike the PT of the Elements, I cannot surmise anything about the properties of any one element on the basis of its position within the table.
Most of the PT of X attempts suffer from trying to hard to force an inappropriate metaphor. And when the metaphor fits poorly, the PT of X still tries to fit into the exact same periodicity as that of the electronic shell structures of the real elements (i.e., 2-6-10-14).
One of the most creative and descriptive non-chemical periodic tables I’ve ever seen was of musical instruments, done by a classmate of my daughter. There was a progression in size from top to bottom, which is sensible for instruments as well as for atomic elements. The groups were separated into morphologies, with strings over here, woodwinds there, the brass section, and percussion. The “Rare Earth” section was a rehash of the above instruments which had been electrified. Aside from the Rare Earths, there was no attempt to force a fit between this arbitrary X and the chemical elements.