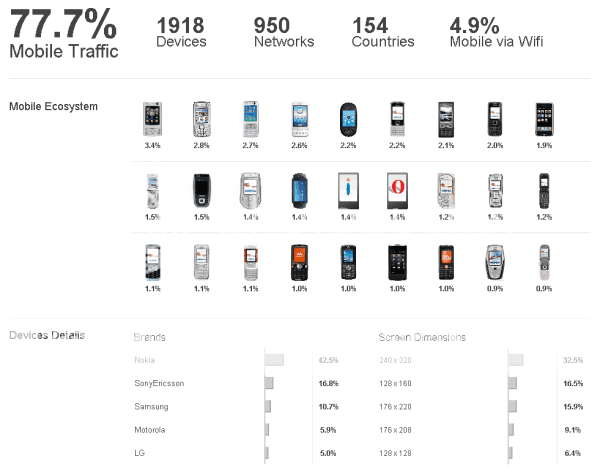
Check out the sample mobile analytics dashboard by Percent Mobile. It is like google analytics, but for mobile device based traffic. I liked the way they presented the information of website traffic that is coming from mobile devices.

What is WOW about it?
The top portion of the dashboard shows quick summary. This is one of the key principles of any good dashboard. Displaying summary at the top and providing detail at bottom. This creates a logical flow and viewer can decide for herself which details to seek.
The bar charts below are executed well. Often we are tempted to use colors and rich formatting, but when you use simple colors, then naturally the attention shifts from formatting to information. I like the way the charts look subtle but still provide good information, thanks to labels.
What can be improved in this chart?
The mobile ecosystem area of the dashboard looks good but it is difficult to spot any trends. Few things I can think of to improve this are,
- Reduce the number of phones displayed here to say Top 5
- Try something else like a tag cloud, but with images. It adds novelty and drives attention to most important devices.
- Restructure information by dimensions like touch-screen devices, gaming devices, good old mobile phones so that viewer will know what type of devices are visiting the site more.
What is your opinion on this dashboard?
Cool or awful? How would you improve it?
More on dashboards: KPI Dashboards using Excel (6 part tutorial and downloads), Excel Dashboards theory, principles and tutorials
[Hat tip to Digital Inspiration for percent mobile]


13 Responses to “Convert fractional Excel time to hours & minutes [Quick tip]”
Hi Purna..
Again a great tip.. Its a great way to convert Fractional Time..
By the way.. Excel has two great and rarely used formula..
=DOLLARFR(7.8,60) and =DOLLARDE(7.48,60)
basically US Account person uses those to convert some currency denomination.. and we can use it to convert Year(i.e 3.11 Year = 3 year 11 month) and Week(6.5 week = 6 week 5 days), in the same manner...
This doesn't work for me. When applying the custom format of [h]:mm to 7.8 I get 187:12
Any ideas why?
@Jason
7.8 in Excel talk means 7.8 days
=7.8*24
=187.2 Hrs
=187 Hrs 12 Mins
If you follow Chandoo's instructions you will see that he divides the 7.8 by 24 to get it to a fraction of a day
Simple, assuming the fractional time is in cell A1,
Use below steps to convert it to hours & minutes:
1. In the target cell, write =A1/24
2. Select the target cell and press CTRL+1 to format it (you can also right click and select format cells)
3. Select Custom from “Number” tab and enter the code [h]:mm
4. Done!
Hi, sorry to point this out but Column C Header is misspelt 'Hours Palyed'
good one
So how do I go the other way and get hours and minutes to fractional time?
If you have 7.5 in cell A1,
- Use int(A1) to get the hours.
- Use mod(A1,1)*60 to get minutes.
If you have 7:30 (formatted as time) in A1
- Use hours(a1) to get hours
- Use minutes(a1) to get minutes.
I had the same issue. You can solve it by changing the format as described above:
Right click cell > Format Cells > (In Number tab) > Custom > Then enter the code [h]:mm
([hh]:mm and [hhh]:mm are nice too if you want to show leading zeros)
Thanks guys, these are the tips I'm looking for.
...dividing the number of minutes elapsed by the percent change is my task - "int" is the key this time
It doesnt work for greater than 24 hours
It returns 1:30 for 25.5 hours. It should have returned 25:30
Ideally I would right function as
=QUOTIENT(A1,1)&":"&MOD(A1,1)*60
Sorry, replied to wrong comment....
----
I had the same issue. You can solve it by changing the format as described above:
Right click cell > Format Cells > (In Number tab) > Custom > Then enter the code [h]:mm
([hh]:mm and [hhh]:mm are nice too if you want to show leading zeros)
Clever use of MOD here to extract the decimal part of a number. Divide a number containing a decimal by 1 and return the remainder. Humm. Very clever.
Thanks very much, extremely useful !