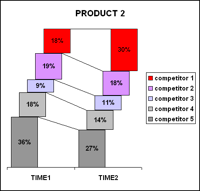
One of our readers Jennifer mailed me with this excel charting problem she is having. I thought why not ask other readers for their advice on this. So here it goes:
The Charting Challenge – Visualizing Changes in Market Share
Here is an excerpt from her email:
The gist of my problem is how to show change-in-market-share between time period 1 and time period 2 for two different products in the cleanest, easiest-to-grasp way.
One of the restrictions that I have are that I have to somehow show both the fact that the mkt shares add up to 100%, and the changes.
However, I am concerned that the main takeaways; increases in competitor 1 is being driven by decreases in competitor 2 … might get lost.
The sample data along with the initial graphs she has built are shown below:


you can access the market share data at this shared google doc.
Now, the question for you is: How would you improve this graphs to bring out the message?
Here are few ways I could think of:
- Reversing the competitor order to 1 at bottom and 5 at top so that comparison can be easy
- Changing the stack overlaps from partial to full so that the step-case look can be removed.
- Instead of stacks, using regular bar charts with 5 sets of columns, 1 each for a competitor and using colors to bring contrast between period 1 and period 2.
Your turn…
PS: you can post images in comments by uploading the images to a free site like flickr or photobucket and then copy pasting the image link in the comment box.


7 Responses to “Extract data from PDF to Excel – Step by Step Tutorial”
Dear Chandoo,
Thank you very much for this and it is very helpful.
However, all the Credit Card Statements are now password protected.
Please advise how can we have a workaround for that
Hello sir,
How to check two names are present in the same column ?
Thanks and Regards
Hi, Thank you for the great tip. One problem, when I click on get data >> from file, I don't see the PDF source option. How can I add it?
I tried to add it from Quick Access toolbar >>> Data Tab, but again the PDF option is not listed there.
I am using Office 365
Hi, Thank you for your video. I see you used the composite table, but I when I load my pdf, it does not load any composite table. It has 20 tables and 4 pages for one bank statement. I have about 30 bank statements that I want to combine. Your video would work except that I can't get the composite table and each of the tables I do get or the pages does not have all the info. what to do?
Dear Chandoo,
How do we select multiple amount of tables/pages in one PDF and repeat the same for rest of the PDF;s in the same folder and then extract that data only on power query.
Thank you
Hi, Thank you for your video. I see you used the composite table, but I when I load my pdf, it does not load any composite table. It has 20 tables and 4 pages for one bank statement. I have about 30 bank statements that I want to combine. nice share
One bank statement takes up 20 tables and four pages in this document. I need to consolidate roughly thirty different bank statements that I have. Your video would be useful if I could only get the composite table, which I can't for some reason, and each of the tables or pages that I can get is missing some information.