In the 4th session of Chandoo.org podcast, lets talk about Pie charts.
Pie charts evoke strong opinions among analysts & managers. Some people love them and can’t have enough of them in reports. Others despise them and go to any lengths to avoid them. And that is why we are going to talk about them in this session.

Before we proceed in to the session, let me remind you:
Get new episodes automatically!
That is right. Chandoo.org uses latest & most magical software. That means, whenever I push the publish button, an army of unicorns & fairies carry the sound-waves and bring them right to your mobile phone or tablet. And all you have to do is subscribe.
- For iPhone or iPod or iPad: Click here to subscribe.
- Andriod Phones & Tabs: Click here to subscribe on Stitcher. (You can download Stitcher free app from that link)
- Windows Phone: For Windows phone, search your podcasts app for our show.
- Or… As always, you can get latest episodes, show notes & resources from our Podcast page.
What is in this session?
This sessions is all about pies, donuts, bars & bubbles. Yummy, I say!
You will learn,

- Special, secret transmission from guest stars
- What is a pie chart?
- Why they work? 2 reasons
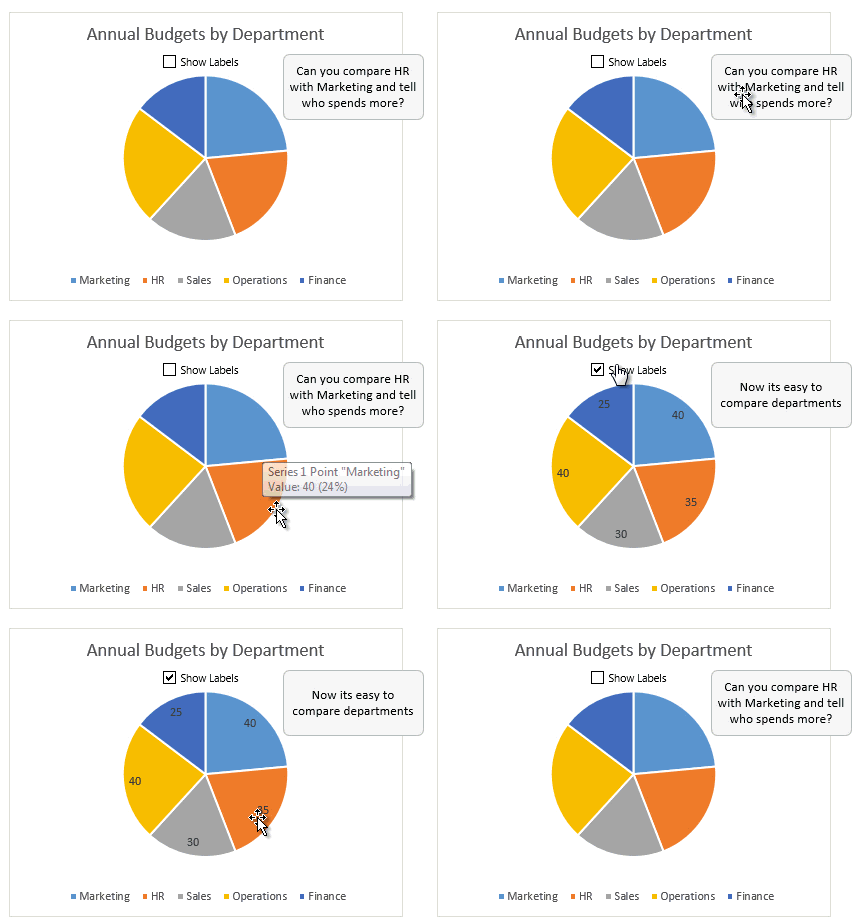
- Why they don’t work ? 4 reasons
- Cousins & siblings of Pie charts
- Donut charts
- Gauge charts (speedometer)
- 3D pies
- Area charts
- Bubble charts
- 4 Situations when making a pie chart is ok
- Alternatives to Pie charts
- Mistakes you should avoid
- About the resources
- Conclusions
Go ahead and listen to the show
Podcast: Play in new window | Download
Subscribe: Apple Podcasts | Spotify | RSS
Links & Resources mentioned in this session:
Books mentioned
Articles & Discussion on Pie Charts
Good examples of Pie charts
Bad examples of Pie charts
Debatable examples of Pie charts
- World polls chart – pie + donut – interesting but questionable
- Pie of a pie of a pie chart – interesting but avoidable
Alternatives & Improvements to Pie charts
Extra resource:
Note about book links: The links to various books mentioned in this podcast are affiliate links. It means when you click on them & purchase, good folks at Amazon pay me a few cents. I recommend these books because I genuinely love them. I would have recommended even if there is no benefit to me.
Transcript of this session:
Click here to download the transcript.
If you enjoy the podcast…,
Please do these 2 things. It means a lot me & our community.
- Subscribe to our podcast on iTunes
- Please leave an honest review on iTunes by clicking here.. It will help the show & its rankings immensely. Thank you so much.
Do you use Pie charts?
I do not avoid them completely. Once in a while I like to throw a pie in to my dashboards. They are a great way to visualize data despite the pitfalls.
What about you? Do you use pie charts? Please share your experience using comments.


One Response to “How to compare two Excel sheets using VLOOKUP? [FREE Template]”
Maybe I missed it, but this method doesn't include data from James that isn't contained in Sara's data.
I added a new sheet, and named the ranges for Sara and James.
Maybe something like:
B2: =SORT(UNIQUE(VSTACK(SaraCust, JamesCust)))
C2: =XLOOKUP(B2#,SaraCust,SaraPaid,"Missing")
D2: =XLOOKUP(B2#,JamesCust, JamesPaid,"Missing")
E2: =IF(ISERROR(C2#+D2#),"Missing",IF(C2#=D2#,"Yes","No"))
Then we can still do similar conditional formatting. But this will pull in data missing from Sara's sheet as well.