Let us take a minute and bask in some glory, for, our little community at PHD had the most fantastic month ever.
That is right, January 2010 is so far the best month since I started blogging. We have broken all sorts of previous records on content, conversations, connections, traffic and revenue.
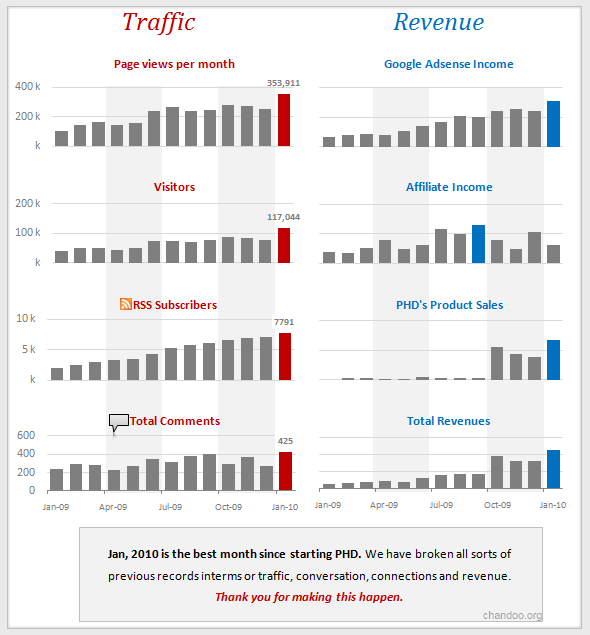
In January, we had 20 posts and 425 comments (highest ever). There were 117 thousand visitors reading 353 thousand pages. Our RSS subscriber base grew to 7790 (it was 2068 an year ago). January is the best month in terms of revenue too. We sold highest number of Project Management Templates and Formula E-books. The site even made more $s on Google Ads than it ever did.
Personally too, the month has been terrific. Jo and I celebrated our third marriage anniversary (we also finished 8 years since we started dating). I got promoted at work and Microsoft renewed my MVP award for one more year. Finally, I got my act together and started working on Excel School.
Awesome is the feeling that comes to my mind. I hope you started the new year with flying colors too.
The website success is all due to YOU. You have been kind enough to comment, e-mail, encourage, ask, share and learn. Without you, this milestone means very little to me. Thank you. Thank you very much.
To celebrate this little achievement, I have indulged in frivolous chart porn and made a small poster. See it below:
(I removed all numbers from revenue section. Lets just say, PHD has been keeping both my mind and pocket happy. 🙂 )

Bonus Charting Tip:
Of course, we dont want to waste a post with some frivolous navel gazing. So, let me share a cool charting trick with you. You can highlight Maximum value in a chart (like above) by,
- First format the entire series in a dull color (like above). To do this, just select the series, change the “fill color”
- Now, click on the series, and while series is selected, just click on the maximum item once again. Now, the maximum item alone will be selected.
- Just change the fill color of this item to some strong, contrasting color (like above).
- That is all… (learn more: using color, charting principles).
PS: Excel School registration opens on Monday. There will be a post announcing it in the next few hours.
PPS: If you are saying Excel What?!?, you should watch this.


2 Responses to “Interview With Presentation Zen’s Garr Reynolds on Charting & Telling Stories”
Most experts recommend using shades of one color for quantitative differences and different hues for qualitative differences.
@Naomi.. that is a good point. I agree with you