All articles with 'using color' Tag
{ 20 Comments }
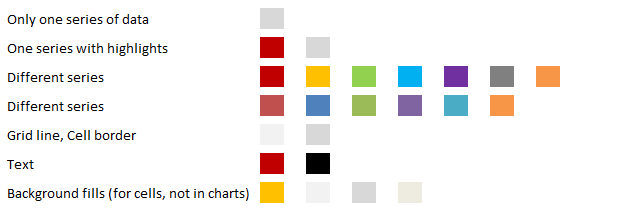
What are your favorite colors for charts?
Published on Apr 23, 2010 in Charts and Graphs
Ok, it is Friday again. That means poll time. I would like to know what color choices you prefer for your charts?
My Favorite Colors for Charting are,
These are the colors I use when making charts in Excel 2007 (it has capability to set any color for chart elements).
Continue »{ 21 Comments }
Best Month Ever (and a charting tip inside)
Published on Feb 5, 2010 in blogging, Charts and Graphs
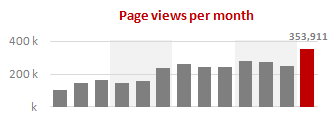
Let us take a minute and bask in some glory, for, our little community at PHD had the most fantastic month ever. That is right, January 2010 is so far the best month since I started blogging. We have broken all sorts of previous records on content, conversations, connections, traffic and revenue. In January, we […]
Continue »{ 1 Comment }
Excel Links of the Week – now even more downloads edition
Published on Feb 1, 2010 in excel links

Welcome to another edition of excel links. During the last week, I have revised excel downloads page on PHD and now it contains over 75 excel templates, tutorial downloads. I am not sure if you dig the new format of the page though. So go take a look at it and let me know what […]
Continue »{ 115 Comments }
Sales Dashboards – Visualizing Sales Data – 32 Dashboard Examples & Implementations
Published on Jan 4, 2010 in Charts and Graphs, Featured

Sales reports and dashboards are very common in any company. There are several ways in which you can visualize sales data to understand the trends and sales performance. So in November, I have asked you to visualize sales data using sample data. The visualization challenge #2, sponsored by Zoho Reports generated a huge buzz around the community and fetched 32 incredible entries. The response was so overwhelming that it took me almost 24 hours to write this post. Thanks everyone for participating and making this a huge learning experience for everyone. Personally I have learned several useful dashboard and charting tricks. I will be sharing some of these lessons with all of you in the coming weeks.
Continue »{ 7 Comments }
Dashboard Best Practice – Google Analytics Intelligence Report
Published on Nov 4, 2009 in Charts and Graphs, Cool Infographics & Data Visualizations
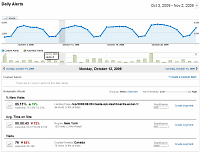
Yesterday while checking my website analytics reports on Google analytics site, I have noticed a new beta feature called “Intelligence”. Out of curiosity I clicked on it. It took me to a an intelligence alert dashboard. Ok, lets just back up for a minute and understand what “intelligence dashboard” is before moving on. In the […]
Continue »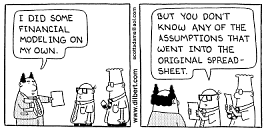
We all have atleast one story of how that one time the boss / co-worker / classmate / cat ruined the carefully crafted excel spreadsheet by mucking up the formulas or disturbing the formatting. Read this post to learn 10 awesome excel tips to make better and boss-proof excel sheets.
Continue »{ 7 Comments }
Charting Lessons from Optical Illusions
Published on Jul 28, 2009 in Charts and Graphs, Featured

The other day while doing aimless roaming on the dotcom alley, I have seen some cool optical illusions. There are so many valuable lessons optical illusions can teach us – chart makers. Don’t believe me? Look at the bubble chart illusion on the left and tell me which orange circle is bigger? What is your answer? Right or left. Well, my friend, the answer is both are of same size. Read the rest of this post to find some cool optical illusions and what they can teach us – chart makers.
Continue »{ 2 Comments }
Interview With Presentation Zen’s Garr Reynolds on Charting & Telling Stories
Published on Jun 15, 2009 in Charts and Graphs
As mentioned earlier, I have met Garr Reynolds of presentation zen fame in Malmo, Sweden last Friday. What was to be a quick 15 minute interview became a 2 hour lengthy discussion on presentations, charting, excel, data, Japanese culture and of course our pointy haired dilbert blog. Read the entire interview in the post.
Continue »{ 12 Comments }
Bonavista Chart Tamer Kicks ass.
Published on May 4, 2009 in Charts and Graphs, excel apps

Over the last few days I have been using Bonavista Chart Tamer tool and I found it pretty neat. Read my review of this wonderful tool.
Continue »{ 16 Comments }
What is Your Opinion on Pie Charts?
Published on Feb 20, 2009 in Charts and Graphs, Featured
Pie charts are one of the most used charts in the world. And for obvious reasons: they are simple to create and easy to understand. When it comes to pie chart, I have no clear opinion. Part of me says use them, the other says avoid them.
What is your opinion on Pie charts ?
Continue »
