
Share your favorite Excel tip & you could win Beats Headphones [Podcast Anniversary Celebrations]
Yay, bring out the birthday hats, candles, cake & confetti. Chandoo.org podcast is 1 year old.

In this one year, we had 31 sessions, 4 guest appearances, 390,000 downloads & lots of 5 star reviews. Thank you so much for making it a grand success so far.
To celebrate the occasion, I want to reward 3 lucky listeners of our podcast.
How to participate in this contest?
- Simple. Figure out what your favorite Excel tip is.
- Open your smart phone’s voice recorder app
- on iPhone use the Voice Memos app
- on Andriod use sVoice or voice recorder widgets
- If you cant find these apps, just Google record audio <your phone name>
- Record the tip (less than 3 mins duration)
- Please say your name at the end of recording.
- Send the audio file by email to hello@chandoo.org
- Do so before end of day 16 March 2015 (Monday)
Once I collect all the tips, I will feature some of them in next episode of Chandoo.org podcast.
Winners of state migration dashboard contest
Finally the wait is over. Here are the winners of our 2014 dashboard contest. Check them out.
Vote for your favorite US state migration dashboard
They are here! the shortlisted 12 entries of our dashboard contest for 2014 are here.
Please take a minute to review the entries and cast your vote. Click here.
Go ahead and cast your vote. Online voting for your favorite entries closes at midnight on 25th June, Wednesday (2014), Pacific time.
Excel Dashboards – 49 dashboards to visualize US State to State migration trends
Hello everyone. Stop reading further and go fetch your helmet. Because what lies ahead is mind-blowingly awesome.
About a month and half ago, we held our annual dashboard contest. This time the theme is to visualize state to state migration in USA. You can find the contest data-set & details here.
We received 49 outstanding entries for this. Most of the entries are truly inspiring. They are loaded with powerful analysis, stunning visualizations, amazing display of Excel skill and design finesse. It took me almost 2 weeks to process the results and present them here.

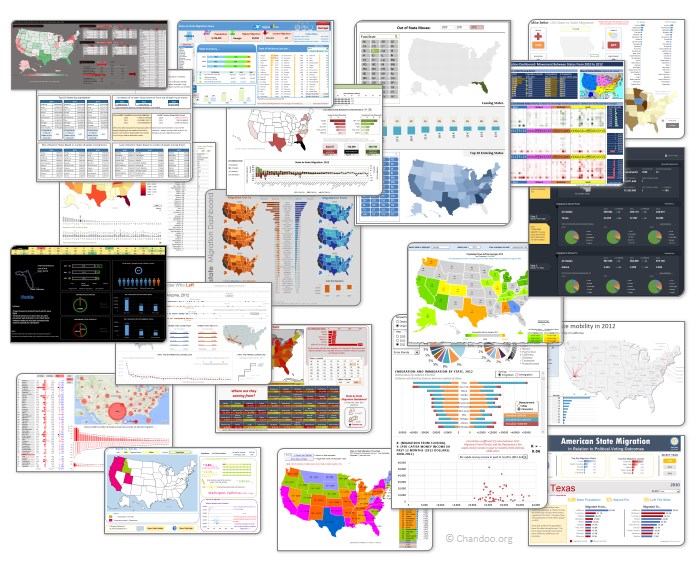
Click on the image to see the entries.
Visualize state to state migration data and you could win an iPad or Galaxy Tab [Datavis Contest 2014]
Time for another dashboard contest. Sit straight, set aside your appointments and get number-crunching.
Analyze state to state migration data between 2012 & 2010 and present your results in a dashboard (or charts) and you could walk away with glory, fame & and an iPad.
If all of this sounds tempting, read on.
The contest
- Download dataset for the contest [mirror]
- Analyze the data and create a dashboard or set of charts (see rules below)
- Submit your workbook by 20th of April (Sunday), 2014.
- If readers at chandoo.org and our panel of judges love your work, you get one of the cool prizes.
I am meeting Mr. Excel aka Bill Jelen tomorrow. What do you want to ask him? (book giveaway too)
 One of the beautiful things about working on internet is you know so much about people even before you meet them first time. I think I first heard about Mr. Excel in 2006, when I started my career as business analyst. I landed on mrexcel.com while searching for something related to doing cluster analysis using Excel. In a way, mrexcel.com inspired me to share my thoughts and techniques on Chandoo.org.
So it wont be an understatement when I say, I feel like a kid in candy store knowing that Bill Jelen aka Mr. Excel is just a few miles away from where I live. Since Rob Collie and Bill are good friends, I asked Rob if we 3 can meet for dinner. And Bill said yes.
I am meeting Bill for dinner on Friday and Rob, Bill & I will be discussing spreadsheets, technology, share our experiences and bump ideas off each other.
Excel Salary Survey Dashboard Contest Winners
Finally the wait is over. Eager to know who won our Excel Salary Survey Dashboard contest? Read on.