
Ashish sends out this SOS thru email,
I need your help in putting filters . Can we filter the cells on the basis of their even or odd character.
i.e in the table of 1-1000, i wish to filter, 1,3,5,7,…
An odd request, I must say.
But nevertheless, possible in Excel.
If you want to filter odd or even rows only in a list of values,
Assuming your data looks like this: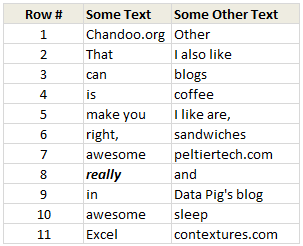
- Add an extra column at the end of your data.
- Type =ISEVEN(B3) to test whether the number in B3 is even or odd.
- Drag the formula to fill the entire range.
- Now filter either TRUE or FALSE values.
- That is all. You have filtered even or odd rows.
PS: If you do not have sequential numbers in your data, you can use =ISEVEN(ROW())
Bonus tips:
- You can filter every third row using =MOD(B3,3) and then filtering out all 0s. Help on MOD formula.
- You can highlight alternative rows in different colors using conditional formatting.
- Or use Excel Tables to automatically zebra-line (ie shade alternative rows in different color).
That Click is here all, for go more ahead on and filters. enjoy.
Just read odd or even words alone.


21 Responses
Infact, instead of using =ISEVEN(B3), how about to use =ISEVEN(ROW())
So it takes away any chance of wrong referencing.
I like Daily Dose of Excel
I like it.
Just a heads up, you do need to have the Analysis ToolPak add-in activated to use the ISEVEN / ISODD functions. An alternative to ISEVEN would be:
=MOD(ROW(),2)=0
rather than use a formula, couldn’t you enter “true” in first cell and “false” in the second and drag it down and than filter on true or false.
Just for clarification, is Ashish looking to filter by even or odd Characters or rows?
so many functions to learn!
Nice support by chandoo and team as a helpdesk. Give us more to learn and make us awesome. Always be helpful…….
In case you want to delete instead of filter,
IF your data is in Sheet1 column A
Put this in Sheet2 column A and drag down
=OFFSET(Sheet1!A$1,(ROWS($1:1)-1)*2,,)
(This is to delete even rows)
To delete odd rows :
=OFFSET(Sheet1!A$2,(ROWS($1:1)-1)*2,,)
If your numbered cells did not correspond to rows, the answer would be even simpler:
=MOD([cell address],2), then filter by 0 to see evens or 1 to see odds.
I sometimes do this using an even simpler method. I add a new column called “Sign” and put the value of 1 in the first row, say cell C2 if C1 contains the header. Then in C3 I put the formula =-1 * C2, which I copy and paste into the rest of the rows (so C4 has =-1 * C3 and so forth). Now I can just apply a filter and pick either +1 or -1 to see half the rows.
Another way, which works if I want three possibilities: in C2 I put the value 1, in C3 I put the value 2, in C4 I put the value 3, then in C5 I put the formula =C2 then I copy C5 and paste into all the remaining rows (so C6 gets =C3, C7 gets =C4, etc.). Now I can apply a filter and pick the value 1, 2, or 3 to see a third of the rows.
Extending this approach to more than 3 cases is left as an exercise for the reader.
Another way =MOD(ROW();2). In this case, must to choose betwen 1 and 0.
very different style Odd or Even Rows very easy way to visit this site
http://www.handycss.com/tips/odd-or-even-rows/
Thanks for the tip, it worked like magic, saved having to delete row by row in my database.
Thanks!
Thankssssssssssssssss
Hi Chandoo- First of all thanks for the trick. It helped me a lot. Here I have one more challenge. Having filtered the data based on odd. I want to paste data in another sheet adjacent to it. How can I do that?
For Example-
A 1 odd
B 3 odd
C 4 even
D 6 even
I have fileted the above data for odd and want to copy the “This is odd number” text in adjacent/next sheet here. How can I do that. After doing this my data should look like this
A 1 odd This is odd number
B 3 odd This is odd number
C 4 even
D 6 even
Hi! Could you please help me find a formula to filter by language?
Thank you!
Chandoo SIR,
I HAVE A DATA IN EXCEL ROWS LIKE BELOW IS THERE ANY FORMULA OR A WAY WHERE I CAN INSTRUCT I CAN MAKE CHANGES , MEANS I WANT TO WRITE ONLY , THE FIG IS FRESH, BUT IN BELOW ROW IT WILL AUTOMATICALLY TAKE THE SOME WORDS FROM FIGS AND MAKE IN PLURAL FORM , WHILE USING ” ARE” LIKE BELOW
The fig is fresh – row 1
Figs are fresh – row 2
The Pomegranate is red – row 3
Pomegranates are red – row 4
=IF(EVEN(A1)=A1,”EVEN – do something”,”ODD – do something else”) with iferron (for blank Cell)