Lets talk about people who inspire us. People who show us that anything is possible. People who prove that commitment, hard work and perseverance are true ingredients of a genius.
I am talking about Sachin Tendulkar. Those of you who never heard his name, he is the most prolific cricketer in the world. He is the leading scorer in both tests (15,921 runs) and one day matches (18,426 runs). Read more about him here.
Tendulkar has been an inspiration for me (and millions of others around the world) since I was a kid. The amount of dedication & excellence he has shown constantly motivates me. It is a pity that the great man is retiring from test cricket. He is playing his last test match (200th, most by any person) as I am writing this.
So as a small tribute, I have decided do something for him. Of course, I have never been a cricketer in my life. Once in college I was reluctantly asked to be a stand-by player in a game with seniors. I did not get a chance to pad up though. That is the closest I have been to a cricketer. So I did what I do best. I made an Excel dashboard celebrating Sachin’s test career.
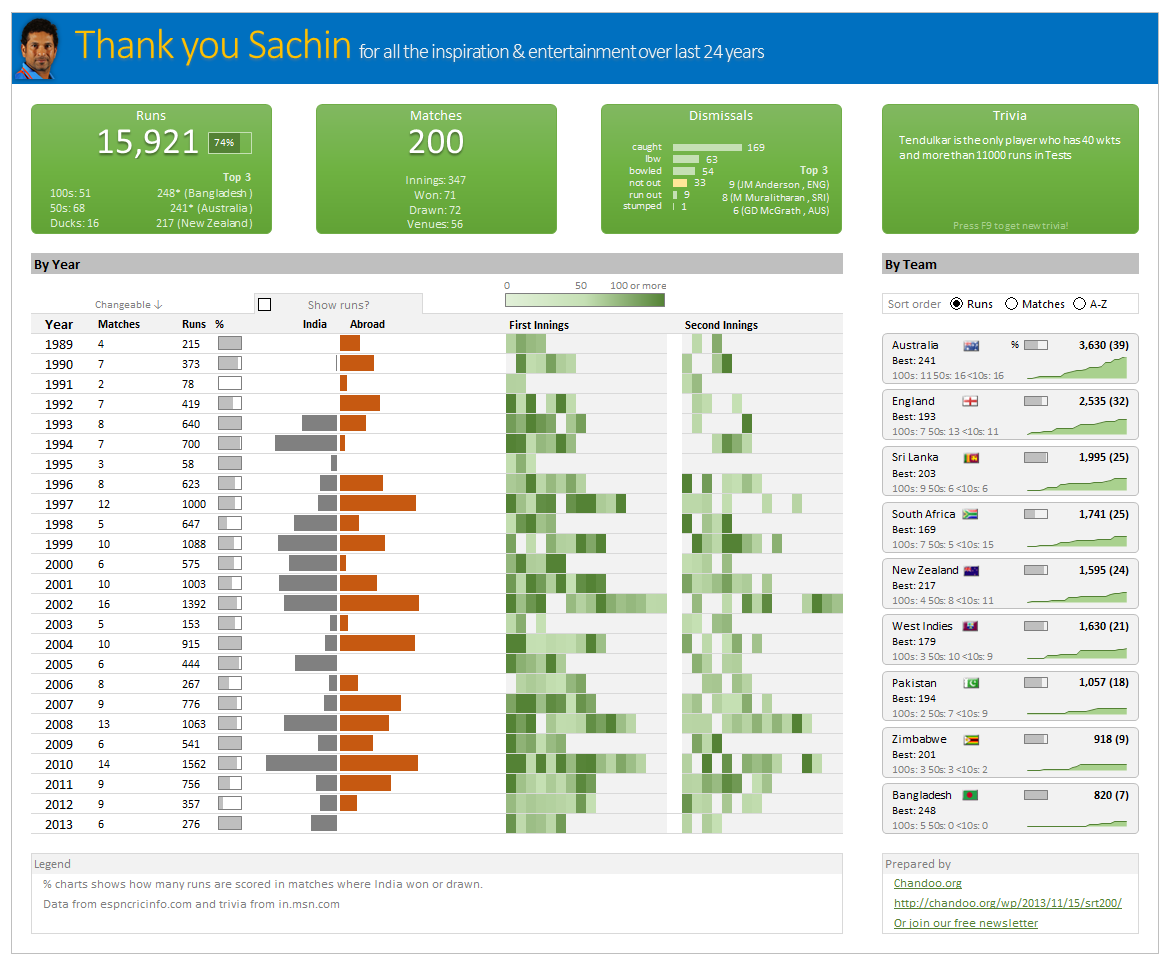
Thank you Sachin – his test career in a dashboard
Here is a dashboard I made visualizing his test cricket statistics. It is dynamic, fun & awesome (just like Sachin).
(click on the image to enlarge)
Download the workbook
Click here to download the file and play with it.
How is this made?
Data:
The data for this dashboard is downloaded from espncricinfo.com and the trivia details are downloaded from in.msn.com
Data from Cricinfo website came in multiple tables. So it took a fair bit of massaging to get everything flow in to dashboard.
Formulas used:
This dashboard uses generous amounts of SUMIFS, COUNTIFS, INDEX, MATCH and VLOOKUP with an occasional LARGE.
For some of the calculations, I have also used Pivot tables.
PS: All the calculations & pivot tables are hidden. Unhide them to go Indian Jones on the dashboard.
Output:
The output dashboard is generated by using various ideas.
- Thermo-meter chart for % charts in the report
- Conditional formatting to show run heat map & India vs. Abroad bars.
- Area charts to show cumulative runs over the years.
- Form controls to capture user choices.
- Sortable country list using pre-sorted pivot tables.
- Picture links to show country flags.
- Text areas & shapes to make the layout of the dashboard.
I have used similar concepts in earlier dashboards. So I am not explaining everything in detail. Instead, let me point you to few detailed tutorials so you get the idea.
Thank you Sachin
Thanks for inspiring me Sachin. For 24 years, if there is a cricket match on TV, I would invariably ask, “Is Sachin playing?”. It would be hard to watch the sport knowing that you will not grace it with your presence. But you have given me and lots of people in my generation something even more valuable. You motivated us to excel in our life. For that I thank you.
Dig sports & Excel? Then you will love these dashboards
If you dig sports & work with Excel, then you are going to immensely enjoy below dashboards too.
- Roger Federer’s Wimbledon win – visualized in a dashboard
- India’s world cup victory in a dashboard
- Sachin Tendulkar info-graphic in Excel
- Official soccer balls in all worldcups in a chart!


8 Responses to “What is LAMBDA? 4 Practical examples to REALLY understand it”
Thanks so much for this, it's utterly brilliant!
Silly question - I assume LAMDA will work with dynamic arrays?
Very much so. Many of the new functions like MAP only make sense in the context of dynamic arrays and Lambda functions.
As usual, very informative material. Easy to understand and apply!
Thanks for making everyone awesome!
Easy to understand Lambda function through this tutorial. Thanks Chandoo.
I have Officce 365 (updated), but I can't see LAMBDA function. 🙁
I dont see "Office Insider" option in my excel 365.
Another option for First Monday...
=LAMBDA(anydate,WORKDAY.INTL(EOMONTH(anydate,-1),1,"0111111"))
Loving the binary options in WORKDAY.INTL David...