How to Get “Either-Or” Condition in Data Validation?

Share

Facebook
Twitter
LinkedIn

In a recent consulting assignment I had a tricky data validation problem. The customer wanted to have an either-or condition in the data validation, like this:

Either Or Data Validation for Input Values in Excel - How to do it?

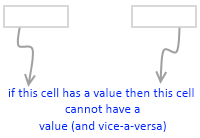
My initial reaction to this requirement was “hmm… that is not possible“. But before shooting the email back to client, I got curious and checked if excel data validation can actually do this. And of course we can do this in Excel with ease.

First see the demo of how this would work:

Either Or Data Validation - Demo in Excel

Now to the specifics:

  1. Select both cells where you want this data validation to be applied.
  2. Now go to data validation (Data Ribbon > Data Validation or Data Menu > Validation)
  3. Specify validation type as “Custom” and use a formula like COUNTA() to check count of cells with a value (see the illustration)
    Data Validation Settings for Either Or Input condition in Excel
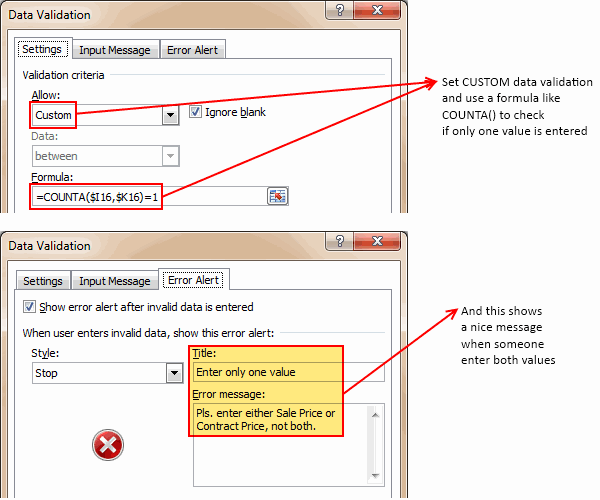
  4. Optional: Use Error Message settings to set a message you prefer.
  5. That is all. Now your Either Or Data Validation set up is done.

Download the example file:

Click here to download the example file with this kind of data validation setup. Play with it and learn how to do this on your own.

Learn more about Data Validation in Excel:

Read more about adding a drop down list validation or advanced data validation tricks or all of them.
Related: Writing XOR (either or) formulas in Excel

Facebook
Twitter
LinkedIn

Share this tip with your colleagues

Excel and Power BI tips - Chandoo.org Newsletter

Get FREE Excel + Power BI Tips

Simple, fun and useful emails, once per week.

Learn & be awesome.

Welcome to Chandoo.org

Thank you so much for visiting. My aim is to make you awesome in Excel & Power BI. I do this by sharing videos, tips, examples and downloads on this website. There are more than 1,000 pages with all things Excel, Power BI, Dashboards & VBA here. Go ahead and spend few minutes to be AWESOME.

Read my storyFREE Excel tips book

Overall I learned a lot and I thought you did a great job of explaining how to do things. This will definitely elevate my reporting in the future.
Rebekah S
Reporting Analyst
Excel formula list - 100+ examples and howto guide for you

From simple to complex, there is a formula for every occasion. Check out the list now.

Calendars, invoices, trackers and much more. All free, fun and fantastic.

Advanced Pivot Table tricks

Power Query, Data model, DAX, Filters, Slicers, Conditional formats and beautiful charts. It's all here.

Still on fence about Power BI? In this getting started guide, learn what is Power BI, how to get it and how to create your first report from scratch.

24 Responses to “Free Excel Risk Map Template”

  1. Ron says:

    Why didn't you include the mitigation or risk IDs in the chart?

    • Chandoo says:

      You can easily add such detail by modifying the TEXTJOIN function. Another way to use them is to add a slicer to highlight all risks that have a specific mitigation strategy or team member assigned to them. I left out those bits fto keep the article short.

      • Rajesh says:

        I tried adding a slicer filter for the mitigation step but the TEXTJOIN is not affected by it. I added a helper column called "Visible" using the AGGREGATE function but I am unable to think of a method to pass that on to the map.
        Could you please help, Chandoo?

        Thanks

      • MyvJ says:

        Hello everyone,

        Another amazing tutorial, great content and tips! My question is about slicers. How do you add slicers to this matrix? I've added 2 columns in my workbook table (Work Stream and Project Name) and I want to be able to filter (slice) the matrix on Project Name, but having some trouble with this. The slicer works fine in the data table, but how do I connect it to the risk matrix, so that only risk titles show up for the selected project?

        Many thanks in advance for your guidance,
        MyvJ

  2. shashi kumar says:

    Can you create a sheet in live stock market data price change with profit and loss graph with time. which could indicate live profit and loss in each time frame 5minute, 10 minute, 15 minute, 30minute, hourly with some modifications

  3. Henrik B. Wieder says:

    Hi

    I've tried to get your formula to work, but likelihood / impact 1/1 does not seem to work.

  4. Sally says:

    Hi Chandoo

    Awesome instructions! Thank you so much, this really helped me.

    I was wondering if it would be possible to list the Risk ID number along with the Risk Title with a dash in between, rather than a bullet point? I have had a try at this but I keep getting a #VALUE error. I can see it's wrong but can't figure out what it should be instead. If you have time do you mind letting me know what I'm doing wrong?

    {=" - " & TEXTJOIN(CHAR(10)&" - ",TRUE,
    IF(RiskRegister[Likelihood]=$A17,IF(RiskRegister[Consequence]=F$3,CONCAT(RiskRegister[ID],RiskRegister[Risk Title]),""),""))}

    Thank you!

    Sally

    • Chandoo says:

      Hey Sally, You are welcome.

      I think the CONCAT inside TEXTJOIN is the culprit. Try this and hopefully you should see the ID too.

      {=" - " & TEXTJOIN(CHAR(10)&" - ",TRUE,
      IF(RiskRegister[Likelihood]=$A17,IF(RiskRegister[Consequence]=F$3,RiskRegister[ID]&RiskRegister[Risk Title],""),""))}

      • Sally says:

        Hi Chandoo
        You're a legend! Thank you so much! I had to make a minor tweak but otherwise it worked perfectly. Here is the tweaked version in case it helps anyone else:

        =TEXTJOIN(CHAR(10),TRUE,
        IF(RiskRegister[Likelihood]=$A8,IF(RiskRegister[Consequence]=C$3,RiskRegister[ID]&" - "&RiskRegister[Risk Title],""),""))

        Thank you again!

        • Ruben says:

          Hi, Im not able to change the formula when trying to add risk Id instead of bullet point.

          trying this: ="• "&TEXTJOIN(CHAR(10)&"• ";TRUE;IF(risks[Probability of Occurance *]=$C5;IF(risks[Severity of potential Impact *]=H$8;risks[Risk ID]&". "[Title *];"");""))

          Cant see any solution on this.

          thankful for help

  5. kris says:

    Hi Chandoo,

    This is perfect - One quick question, How can I add a hyperlink to the risks - So that I can click on the particular risk and it takes me to the actual row of that item.

    Many thanks in advance.

  6. SY says:

    HI Chandoo,

    Is there a way to only display filtered item. Once the list gets big, it's hard to see all risk.

    Kind regards,
    SinYen

  7. Jim says:

    Hi Chandoo,

    Quick question

    1) Is there a way to remove duplicates within each risk block?
    2) Is there a way to have the results in the chart update based on a filter or slicer?

    Thanks a lot

  8. Lebo says:

    Hi Chandoo,

    The risk map is a brilliant tool, and I wanted to the risk map to only show Open risks. How can I do that?

  9. Eric M says:

    Just found this today as I am making a risk matrix as well. I got the formula to work with this, where a risk score is above 30. Risk score = probability*impact*modifier.

    So this works flawlessly, ="- "&TEXTJOIN(CHAR(10)&"- ",TRUE,IF('Risk tracker'!G4:G27>=30,IF(Table1[Urgency]="Now",'Risk tracker'!A4:A27,""),""))

    I am trying to find a range now. Risk score in between 21-29. I tried using the AND function, but I couldnt get it to work. Is there anyway to get this formula to work with a range as mentioned above?

    • Chandoo says:

      Thanks Eric.

      You can't use AND() as it is not able to return arrays. You can try below formula.
      ="- "&TEXTJOIN(CHAR(10)&"- ",TRUE,IF(('Risk tracker'!G4:G27>=21)*('Risk tracker'!G4:G27<=29),IF(Table1[Urgency]="Now",'Risk tracker'!A4:A27,""),""))

  10. Michal says:

    Hello, this template is nice, thank you but im facing a problem when I need to find a range of impact. I cant figure out how..

    My actual form is "="• "&TEXTJOIN(CHAR(10)&"• ";TRUE;IF(Table1[Impact]=A8;Table1[Title];"");"")"

    Where A8 is number "1" so this formula finds everything with impact 1 and shows the titles.
    What I need to get is a range so,
    A8 is "1" and A9 is "2" and I need the formula to find all titles which impact is between 1 and 2.
    I tried the AND function and so on, nothing worked..

    Can you help me please?

  11. masoud says:

    i tried everything in your video in the end i only get the bullet... please guide me through

    • masoud says:

      Sorted it... i was flash filling the other cells and it took other columns...

      i do have another question though... how can i use slicers to filter the content of the matrix, so that it'll show only the departments i select?

      slicer is working fine with the table, but the matrix still shows all the results

  12. JP says:

    Just want to thank you for this.

    It is awesome.

  13. MyvJ says:

    Hello everyone,
    I think I accidentally nested my question in another thread. Apologies!
    This is another amazing Excel tutorial, with great content and tips! My question is about slicers. How do you add slicers to this matrix? I've added 2 columns in my workbook table (Work Stream and Project Name) and I want to be able to filter (slice) the matrix on Project Name, but having some trouble with this. The slicer works fine for the data table, but how do I connect it to the risk matrix, so that only risk titles show up for the selected project?

    Many thanks in advance for your guidance,
    MyvJ

  14. Josy says:

    This is another amazing Excel tutorial! My question is about slicers. How do you add slicers to this matrix? Please advise

Leave a Reply