
Ok, it is Friday again. That means poll time. I would like to know what color choices you prefer for your charts?
My Favorite Colors for Charting
These are the colors I use when making charts in Excel 2007.
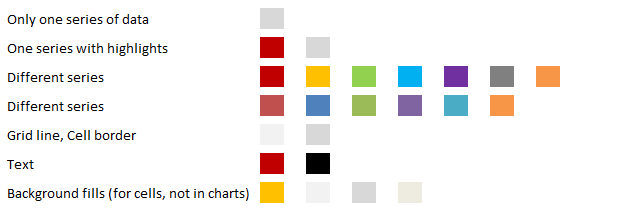
Here is a file with all these colors, so that you can copy them to your charts right-away.
Also, these are the colors I recommend in an e-book (you get a copy of that free with Project Management Templates) for people making charts:
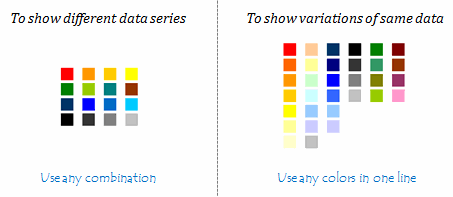
What about you?
Share your favorite colors thru comments.
Just list down the RGB codes of your color choices.


4 Responses to “Office 2010 Contest Winners are here!!!”
I while ago I wrote a post on selecting a couple of names from a range via an UDF
I could have been handy.... especially because I didn't win.... lol
http://xlns.lamkamp.nl/?p=14
Sweet! I won! Thank you so much, Chandoo! I'm really speechless! I'll look out for an e-mail from you. Again, I really appreciate it, and I can't wait to fire it up!
Sincerely,
Tom "this one" 🙂
Thank You... Thank You... Thank You... 🙂
Hi,
Don't want to ruin your party.. 😉 but I noticed that when you sort the list A2:B11 (step 2), the RAND function re-calculates the numbers so that they are different and in mixed order again. I had to paste the whole area as values first and then sort to get it to work.
Wonder if the same happened to you because in your list at least Greg has a higher value than Tom 🙂