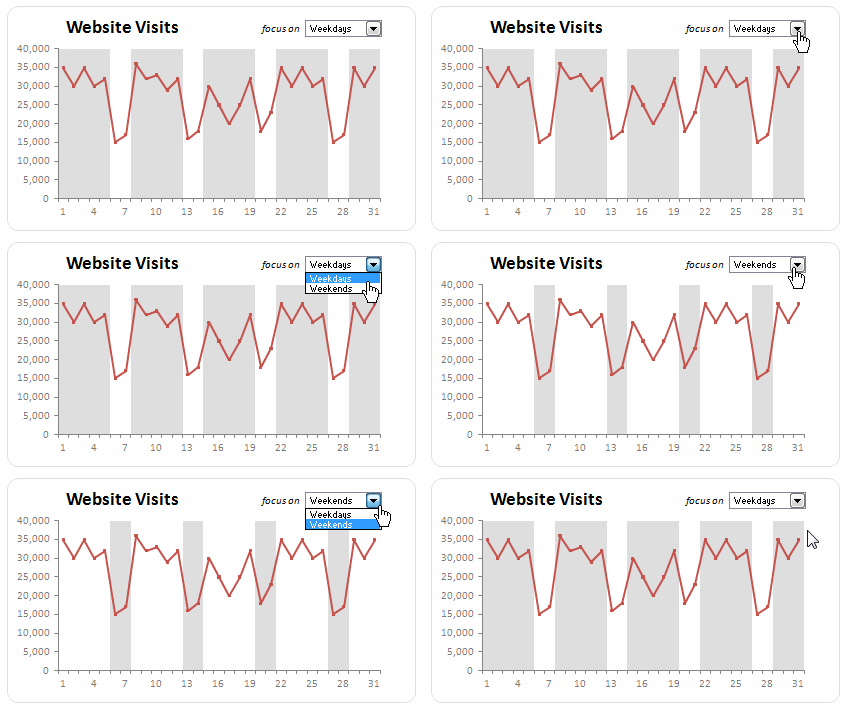
Yesterday we have posted how to use excel combo charts to group related time events. In the comments, Art Johnson says,
This is awesome. I love this blog. I have dealt with this issue before. Usually my issue is monthly anomolies caused by fiscal months of 4 weeks followed by 4 weeks, and then 5 weeks in each quarter. This causes a spike in March, June, Sept., and Dec. It’s one reason I prefer to look at quarterly trends rather than monthly. This chart is quite nice to see these effects. Is there a way to just toggle between two charts? One of weekends and one of weekdays? […]
This effect can be easily achieved with a cup of coffee, one combo box form control and the good old IF formula. Look at it yourself.

I am not going to provide the complete recipe. But here is the gist. I am sure you can take the help of that coffee in case you are stuck.
- Add a combo-box form control using forms tool bar or Developer ribbon. (not able to find the developer toolbar in excel 2007? see this)
- Set the input range for combo box to two cells where the values “weekdays” and “weekends” are mentioned.
- Also set the “cell link” for the combo box to some free cell like IV32000
- Now change the dummy series (the range where the column chart values for zebra lines are mentioned) values to a formula.
- The formula should be able to change the dummy values based on the selection in combo box. This is your homework to figure out.
- That is all. You now have a chart that dynamically groups events based on user selection. Pretty cool eh ?
Download the workbook and see it yourself
Click here to download the workbook and play with it.
Where can you use this technique?
Oh, several places. To begin with,
- To highlight new products vs. older products in a product-wise sales chart
- To highlight top 10 vs. bottom 10 values in a big chart
- To highlight values of a certain product / project vis-a-vis the whole set of values
What do you think about this idea?
Have you ever tried similar ideas in a report or dashboard? What is your experience? Personally I find dynamic charts more effective compared to static charts. Users like them, they like to play with the control(s) and make their own observations. Do you agree?
PS: If you are looking for a way to compare 2 KPIs or metrics in charts, see the part 5 of dashboard tutorial


13 Responses to “Data Validation using an Unsorted column with Duplicate Entries as a Source List”
Pivot Table will involve manual intervention; hence I prefer to use the 'countif remove duplicate trick' along with 'text sorting formula trick; then using the offset with len to name the final range for validation.
if using the pivot table, set the sort to Ascending, so the list in the validation cell comes back alphabetically.
Hui: Brillant neat idea.
Vipul: I am intrigued by what you are saying. Please is it possible to show us how it can be done, because as u said Hui's method requires user intervention.
Thks to PHD and all
K
Table names dont work directly inside Data validation.
You will have to define a name and point it to the table name and then use the name inside validation
Eg MyClient : Refers to :=Table1[Client]
And then in the list validation say = MyClient
Kieranz,
Pls download the sample here http://cid-e98339d969073094.skydrive.live.com/self.aspx/.Public/data-validation-unsorted-list-example.xls
Off course there are many other ways of doing the same and integrating the formulae in multiple columns into one.
Pls refer to column FGHI in that file. Cell G4 is where my validation is.
Vipul:
Many thks, will study it latter.
Rgds
K
[...] to chandoo for the idea of getting unique list using Pivot tables. What we do is that create a pivot table [...]
@Vipul:
Thanks, that was awesome! 🙂
@Playercharlie Happy to hear that 🙂
Great contribution, Hui. Solved a problem of many years!
Thanks to you, A LOT
Hi Hui,
Greeting
hope you are doing well.
I'm interested to send you a private vba excel file which i need to show detail of pivot in new workbook instead of showing in same workbook as new sheet.
Please contact me on muhammed.ye@gmail.com
Best Regards