
Update 1: you can make a chart or dashboard or combo chart.
Update 2: Download file changed, fixed an error with dates.
Update 3: We got a sponsor, it is Zoho. Scroll down to see more.
Here is a challenge many people face. How to make a chart visualizing sales data with several dimensions like product, brand, region, sales person name, year (or month or quarter) and one or two values like sales, # of units sold, profits, # of new customers.
In visualization challenge #2, all you have to do is a make one chart (dashboards are ok too) to visualize this sales data effectively.
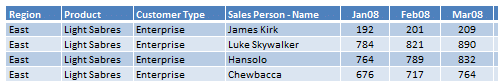
The Data
Download the CSV file with data [mirror]. It has 28 columns – Region,Product,Customer Type,Sales Person Name and 24 Months starting Jan 08.
The Objective
You have to make one chart (or dashboards) using this data that would help a senior manager understand how the sales people have done in the 24 months. The chart can be dynamic / interactive / macro based. You can use any software (not just excel) to make this chart.
The Booty
The winner gets an … wait for it … iPod Touch 8GB sponsored by good folks at Zoho Reports. That is right. We are going all out to make sure you submit the best.

2 more contestants will get a complimentary copy of project management bundle for excel.
The Fineprint, read all of these before you start your engines:
- You can submit any number of entries.
- You are free to change the actual numbers in the data. I just used RANDBETWEEN () to get these values. You can replace them with some other numbers if you want.
- The contest is open from now to 28-Nov-2009.
- Winner will be selected using a poll by our readers.
- There is a second and third prize too. 2 contestants will get one copy of Project Management Templates Set.
- You can use any software, but you must submit the source files (or alteast stuff close to that) so that our readers can download and play with the files.
- International contestants – If Amazon or Apple don’t ship the iPod to your country, we are still cool. You can choose to have some other product that can be bought online and delivered to you, because we are awesome like that.
How to submit entries?
- Download the data and make the chart(s).
- Upload the chart source files, any images to a free online storage service like skydrive.
- Drop a comment here with links to your files.
- Alternatively e-mail the files to me (I am e-mail rustic. So expect few days delay before I upload them somewhere) at chandoo.d @ gmail.com
- Please note: You agree that the files you submit can be freely distributed to readers on PHD for learning purposes.
Contest Sponsored by Zoho Reports
![]() This contest is sponsored by awesome folks at Zoho Reports, Online Reporting and Business Intelligence Service
This contest is sponsored by awesome folks at Zoho Reports, Online Reporting and Business Intelligence Service
Please spread the message:
Take a minute and e-mail a friend or tweet about this contest or share this on facebook. The more people participating in this, the better it is for us. We can learn several interesting implementations.


23 Responses to “Learn Top 10 Excel Features”
What it looks like if excel without formula?? 🙂
It would be not excel it would just be fancy tables in which you could just use power point. (Chandoo) would Access be an alternative?
Awesome piece of work!!!
Great article.
Chandoo - my biggest interest in the article was the awesome word-graphic at the top - where did you go to get it done into a shape?
@Rich.. thank you. I used http://www.tagxedo.com/ to generate this word cloud. I took all the comments in the original post, pasted them in tagxedo website and set up the shape etc.
Awesome Chandoo.. You need always needs coffee to start up with. BTW , how did u created the Heart Shaped picture filled with High Repetitive text in it .. Please put it on your Next blog ...
Chandoo, good article. I’ve added a link to it from Connexion – our collection of the most useful and interesting spreadsheet-related articles from the web. See http://www.i-nth.com/resources/connexion
Hi,
Just one small question. Where the hell have been I in the past for not discovering this website sooner?
I've lost a job interview recently where even though I had the subject knowledge, I was not upto their mark in Excel.
Thank you for all the free tips, guidance and for creating this forum environment.
[PS: I've just been through the site for the 1st time, and have signed up for the newsletter. You can expect pretty stupid questions from me soon]
Hy Chandoo, you always inspire me with to explore something new in excel. This data structure table is only for excel 2007 or compatible to 2010. I recently installed latest excel version 2013 in my System and experience problems regarding operating according to previous one. I'm waiting your article relates to that excel version.
Thanks
Awesome article Mr. Chandoo and that is a awesome heart shaped pic you created. Great tips as well.
[...] Learn Top 10 Excel Features | Chandoo.org – Learn Microsoft Excel Online. [...]
Chandoo is awesome..
Thanks, i got better, And i always get 90.50 in my grade card but now i get 96.50 i improved because of the tutorials you gave, Thank You Very Much Chandoo Guy.
Hi chandoo, i am intersted in seeing the video or step by step done procedure of analysing the comments and presenting in the data percentage steps. I think this one would be first step in finding out how generally happens data calculation. Thank you.
As well i would like to know how to get that black shape art of your face which i see in chandoo. I am interested in making it for me.
Nice to see the features considered by Excel users to be most useful. It might be a good idea to also analyze StackOverflow Excel questions to see what keywords appear most often.
Here are my top 10 Excel Features (for advanced users):
http://www.analystcave.com/excel-10-top-excel-features/
Thanks a ton for this it totally helped with my homework ????
Very good effort
Thank you for this. Lots of learning in the links you've provided for this septuagenarian.
Pls send me new post
Dude, your humor ? ?
Loved your work.
Hello Sir,
I am Sanjeev Khakre and i from Indore City, India , I am your big follower and i have watch your videos and learnt a lots of excel trick or function and many more . thanks so much for all of your excellent support.
Your excel knowledge is real awesome.
Thanks
Sanjeev
Your work is excellent but pls willing to know more details about the features of microsoft excel
Chandoo Would Access be a better alternative than VB?