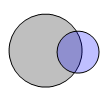
 This post is a testament that readers of this blog are way cooler and enterprising than I am. Justin, who I must say, has some really amazing excel skills, contacted me in April with a VBA Script he made that can draw two circle Venn diagrams in excel. He wrote,
I regularly need to show the intersection between different populations (venn diagrams) and have struggled to find anything useful in XL2000 or XL2003
Most examples are static pictures of circles created in a graphics program to which users add labels – hardly ideal
While still a WIP – I’ve come up with a simple 2 circle venn tool.
It uses drawing objects [msoShapeOval] (nice to get the transparency)
I saw the script and was really impressed by the way it worked. I wrote back to him asking if it is ok to share this with the readers on PHD. And he said OK. Ever since I have been wanting to share this wonderful little tool with all of you.
Without further ado…
Venn Diagrams in Excel

1. First download the Venn diagrams in excel zip file from here [xls version here].
2. Now when you try to open the file, you must enable macros (in excel 2007, you may want to set the security to low and then reopen the file)
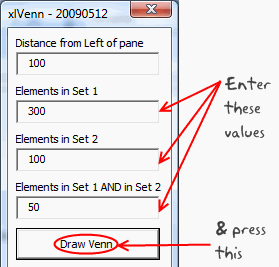
3. Click on the big button you see in the first sheet and specify the venn diagram details (how many in each circle, what is the intersection amount)
4. Click the “Draw Venn” button and you have a sparkling venn diagram ready
Once again, I really appreciate Justin for putting together such a nice tool and sharing it will all of us. Thank you 🙂
PS: If you like this, do say thank you to Justin in comments. I am sure he can take pretty much any amount of appreciation.


12 Responses to “Analyzing Search Keywords using Excel : Array Formulas in Real Life”
Very interesting Chandoo, as always. Personally I find endless uses for formulae such as {=sum(if(B$2:B$5=$A2,$C$2$C$5))}, just the flexibility in absolute and relative relative referencing and multiple conditions gives it the edge over dsum and others methods.
I've added to my blog a piece on SQL in VBA that I think might be of interest to you http://aviatormonkey.wordpress.com/2009/02/10/lesson-one-sql-in-vba/ . It's a bit techie, but I think you might like it.
Keep up the good work, aviatormonkey
Hi Chandoo,
You might find this coded solution I posted on a forum interesting.
http://www.excelforum.com/excel-programming/680810-create-tag-cloud-in-vba-possible.html
[...] under certain circumstances. One of the tips involved arranging search keywords in excel using Array Forumlas. Basically, if you need to know how frequent a word or group of keywords appear, you can use this [...]
@Aviatormonkey: Thanks for sharing the url. I found it a bit technical.. but very interesting.
@Andy: Looks like Jarad, the person who emailed me this problem has posted the same in excelforum too. Very good solution btw...
Realy great article
"You can take this basic model and extend it to include parameters like number of searches each key phrase has, how long the users stay on the site etc. to enhance the way tag cloud is generated and colored."
How would you go about doing this? I think it would need some VB
Hi,
I found the usage very interesting, but is giving me hard time because the LENs formula that use ranges are not considering the full range, in other words, the LEN formula is only bringing results from the respective "line" cell.
Using the example, when I place the formula to calculate the frequency for "windows" brings me only 1 result, not 11 as displayed in the example. It seems that the LEN formula using ranges is considering the respective line within the range, not the full range.
Any hint?
@Thiago
You have to enter the formula as an Array Formula
Enter the Formula and press Ctrl+Shift+Enter
Not just Enter
Thank you, Hui! I couldn't work out how this didn't work
is there a limit to the number of lines it can analyse.
Ie i am trying to get this to work on a list of sentances 1500 long.
@Gary
In Excel 2010/2013 Excel is only limited by available memory,
So just give it a go
As always try on a copy of the file first if you have any doubts
Apologies if I am missing something, but coudn't getting frequency be easier with Countif formula. Something like this - COUNTIF(Range with text,"*"&_cell with keyword_&"*")
Apologies if I missed, but what is the Array Formula to:
1. Analyze a list of URL's or a list of word phrases to understand frequency;
2. List in a nearby column from most used words to least used words;
3. Next to the list of words the count of occurrences.