
Christmas & New year have a special place in our hearts. Around our household, we have the official festive season from September last week to February 2nd week. In these 5 odd months, we celebrate all our birthdays, our marriage anniversary, a lot of fun festivals, not to mention Christmas & New Year. This year, it is even more special because we have 2 noisy, hilarious & rowdy kids to share and multiply our joy.
We wish you a Merry Christmas & Happy New Year.
I also want to tell you that how much thankful I am to you. Without you, I wouldn’t be spending this holiday season with my family. Because you find me useful, and support me thru your visits, purchases, comments & enthusiasm to learn that I have the courage to leave my day job to embark on this exciting journey called chandoo.org. Thank you.
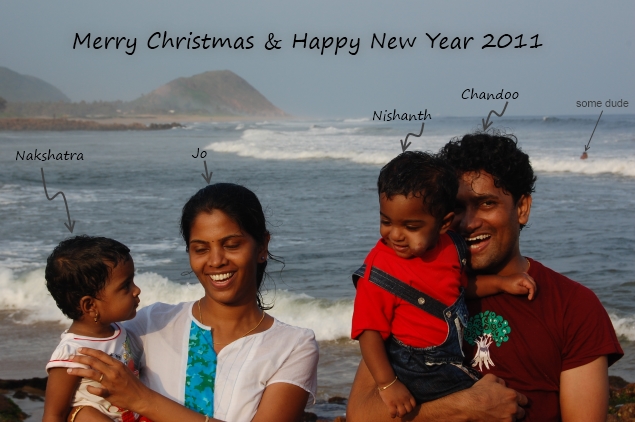
About this year’s Christmas Card:
If you have ever tried to photograph a child, you know how difficult it is to capture the perfect moment. Now imagine capturing the perfect moment for twins. After numerous attempts to get a perfect family photo where all 4 of us are smiling, we gave up. Instead, this year, we picked the most-un-synchronized photo. None of us gave a good pose, and yet, we are happier than ever. 🙂
A Special Holiday Gift for you
Holiday Posting Schedule at Chandoo.org
This holidays I will be blogging little. I mention the schedule of posts from now thru New Year 2011 below so you can enjoy your holiday instead of worrying what you will miss.
- 24 Dec – no post
- 25 Dec – no post
- 26 Dec – no post
- 27 Dec – no post
- 28 Dec – Round up Christmas & New Year Spreadsheets for you
- 29 Dec – People & Blogs that helped in Year 2010 – Thank you Message
- 30 Dec – Best of Chandoo.org – the Awesomest Excel Stuff in Year 2010
- 31 Dec – no post
- 3 Jan – Excel Links – Happy New Year Edition
Forums:
Chandoo.org Excel Forums will continue to operate during holidays. I will not be participating much in discussions though, but I will check new posts once a day and try to provide quick answer if I can. Don’t blame me if I sound too cheerful in the reply to your pressing-problem-that-must-be-solved-RIGHT-NOW!.
Online Store:
Our online store will be open all through out. Go ahead and purchase something if you need. Your product deliveries are automatic. Please call me on +91 814 262 1090 or +1 206 792 9480 if you have some questions. Pay no attention to noisy kids in the background if you do call.
Email:
I will try to clear my inbox once a day during holidays. If you do not see a reply even after New Year, be kind and send me a reminder. I promise to send good thoughts your way along with reply 🙂
Once again we wish you a Merry Christmas & Happy New Year 2011.
PS: Make sure you sign-up for our Free Newsletter or add RSS Feeds to your news-reader so that you get new posts & tips as they go live.


32 Responses
Hi Chandoo, You have also czech fan.
D?kuji a š?astný nový rok 2011!
Thank you for this blog which is a great source of inspiration for me. Nice to see you and your family so happy.
All the best for 2011.
Thank you, Chandoo. I continue to love (and depend on) your blog and forums.
Happy Holidays to you and your beautiful family.
TE
Beautiful picture. Keep up the good work, happy Christmas to you.
Beautiful photography, Merry Christmas and Happy New Year, thanks for everything.
Regards,
I imagine the photographer’s happy face in front of an awesome family with the Bay of Bengal in the background. Excellent!
Enjoy a well deserved holidays!
Really gonna miss your brilliant posts, you have changed my style of working.
Thank you Guru Ji!
Merry Christmas and Happy New Year 2011
I wish you all Merry Xmas. Keep smiling and shining!
Thank you for all you do and happy holidays!!
Chandoo and Jo,
The picture of you and your family is so beautiful – thank you for sharing; and, thank you, for your Christmas wishes. I look forward to the New Year and all the good information that you provide – Thank you.
Merry Christmas and Happy New Year!
Have a Happy & Festive Holiday! I am so looking forward to implementing all that I have learn from you this next year.
Merry Christmas ! …. A Perfect Kodak Moment Snap 🙂
I have just joined these blogs n forums and it has been a great learning …. so much more to learn from the forums, blogs n site almost everyday …. looking forward to many more once you are back !
Happy holidays from the other Excel twin family !
Can’t wait to read your posts next year !
Beautiful picture!
Best wishes for a great Christmas & a happy New Year
From a VERY cold Scotland.
The perfect picture, tells a lovely story about a happy family.
Whilst I am not an active participant on your forum, I do enjoy reading your emails. Keep up the great work and well done for leaving your job.
Thanks Chandoo.. Merry Christmas and a Happy New Year to you and your family 🙂
Keep Rocking in 2011 and years to come..
Cheers
Rohit1409 🙂
Hi Chandoo,
Wish you and your family MERRY CHRISTMAS & HAPPY NEW YEAR.
I’ll be off for next 10 days for family tour to Madhya Pradesh. Will start working on 4th
Enjoy Christmas & New year.
Kalyan
Merry X-mass Chandoo to you and your family. That is a very nice family photo.
Also, many thanks for your posts and schools during 2010, I have learnt so much I have been promoted at my current place of employment after producing a model that blew management away. All of the ideas have come from you and your readers. Once again many thanks.
No, you cannot get a cut of my payrise.
Are you sure that ” dude” in the photo is OK?
Richard
Hi Chandoo,
I have been your student (without paying the school fees ofcourse) for the past 8 months or so and I have grown to be an expert in excel and believe me only from your blog!
I wish you and your lovely family a Happy Christmas and Prosperous New year from the Serengeti.
Kwa heri,
Beno
Thanks a lot Mr Chandoo.. Merry Christmas and a Prosperous New Year to you and your family.
I am looking forward to implement all that I have learnt from you.
May God shower upon all his blessings to you and your family. Keep continuing the noble service….
With Wishes
V S Venkatraman
Hi Chandoo,
Thank you very much for all the great samples and teachings. I look forward to more and better in 2011. Wish you a Merry Christmas and a happy new year!
Frederick
Thank you, Chandoo and Happy Holidays.
Merry XMas Chandoo (and convey to “some dude” too). Have a blast and enjoy the time off.
Ninad.
Merry Christmas and Happy New Year, Chandoo. Thanks for all you do to make us excellent!
Merry Christmas and a very Happy and Prosperous New Year to you and your beautiful family! You are awesome! May your business continue to grow beyond your wildest dreams!
Merry Christmas and Happy New Year Chandoo!
You are simply incredible !! chandoo !!
Thank you very much Chandoo for all you have done for so many people in this forum and the new ones joining up in next year…. You deserve a much needed holiday break. Your family is beautiful and this is a photo very well clicked…
Merry Chiristmas and Happy New Year!!!
Sou
Great picture. I wish you a great new year ahead.
Chandoo, beautiful family! A BIG thank you for all that you do. Happy New Year!
Thank you so much for the wishes everyone. We had a beautiful holiday seasons this time. Here is a pic from the holidays.
Hi,
Thank you for creating and maintaining such informative site. Wish you and your family a very happy new year.
Abhi
Oh my goodness! Awesome article dude! Many thanks, However I am going through troubles with your RSS.
I don’t know the reason why I am unable to subscribe to it. Is there anybody having similar RSS problems? Anyone that knows the answer can you kindly respond? Thanks!!