fbpx
Search
Close this search box.

[Weekend Poll] How do you Sex up your Charts?

Share

Facebook
Twitter
LinkedIn

This weekend, let us talk … umm… charts. I want to know if you absolutely make sure your charts look good everytime you sent them out to someone. I do this most of the time.
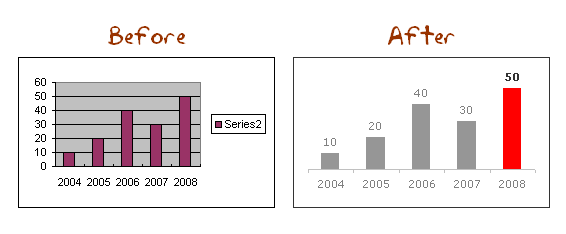
My usual chart sex up routine is,

  • Remove the background
  • Add labels and remove grid lines and legend
  • Highlight necessary data and set some dull color to the rest (if needed)
  • Change fonts, most often change them to Verdana
  • Format axis and axis labels

Of course, I don’t do this every time. Instead I use some user defined charts and save tons of time.

How do you sex up your charts? or you say “not tonight honey” to them.

Learn 2 more charting principles in naughty but totally fun way: Is your chart’s underwear showing? | Are you making blow charts?

Facebook
Twitter
LinkedIn

Share this tip with your colleagues

Excel and Power BI tips - Chandoo.org Newsletter

Get FREE Excel + Power BI Tips

Simple, fun and useful emails, once per week.

Learn & be awesome.

Welcome to Chandoo.org

Thank you so much for visiting. My aim is to make you awesome in Excel & Power BI. I do this by sharing videos, tips, examples and downloads on this website. There are more than 1,000 pages with all things Excel, Power BI, Dashboards & VBA here. Go ahead and spend few minutes to be AWESOME.

Read my storyFREE Excel tips book

Overall I learned a lot and I thought you did a great job of explaining how to do things. This will definitely elevate my reporting in the future.
Rebekah S
Reporting Analyst
Excel formula list - 100+ examples and howto guide for you

From simple to complex, there is a formula for every occasion. Check out the list now.

Calendars, invoices, trackers and much more. All free, fun and fantastic.

Advanced Pivot Table tricks

Power Query, Data model, DAX, Filters, Slicers, Conditional formats and beautiful charts. It's all here.

Still on fence about Power BI? In this getting started guide, learn what is Power BI, how to get it and how to create your first report from scratch.

4 Responses to “[Weekend Poll] How do you Sex up your Charts?”

  1. Andreas says:

    You might consider removing the category axis labels

    Andreas

  2. Tony Rose says:

    I can just imagine the SPAM you're getting with this post.

  3. Chandoo says:

    @Andreas: I doubt if that would lead to information loss as there is no way to know what we have plotted here then.

    @Tony: yeah... but askimet does the dirty job

  4. Nando says:

    Are these the only tips you have, these are extremely basic and frankly i was expecting a lot more. The chart is very unclear, not titles are axis headings! Disappointed!

Leave a Reply