
This is a guest post written by Joel Zaslofsky, author of Experience Curating.
How to Make “Put It in a Spreadsheet” Who You Are (and Not Just What You Do)
It seemed like a crazy question:
Could I use my passion for Excel as motivation to transform my leaky brain from a weakness into a strength?
Sure, I already had a fifteen year love affair going with Excel.
Every other email I sent to my co-workers had an attached Excel spreadsheet. And when I wasn’t using Excel for work purposes, I was using it for grocery list templates or budget tracking.
But I had to discover the answer to my crazy question.
So I told my wife Melinda in January 2012, “Honey, this is the year I put it in a spreadsheet!”
As I reveal in my article Spreadsheets and You, Melinda shot me a puzzled look. Was I joking? Should she ask me to elaborate?
She gingerly responded, “You’re going to put what in a spreadsheet?”
I shot her back a grin and said, “Everything!”
Experiences with videos, books, recipes, quotes, songs, online content, conversations, fleeting thoughts … everything. Little did I know that I was about to experience the gorgeous love child of curating and spreadsheets.
Hold on to your hat, my friend. You’re about to see how I use Excel to curate my entire existence. It’s something I call “Experience Curating,” and this is where things gets juicy.
The Power of Excel: Formulas and Numbers Optional
Wait a moment.
Isn’t there a Chandoo policy against publishing posts without awesome formulas or behind-the-scenes Excel strategies?
Fortunately, there isn’t (thanks, Chandoo!).
I respect my Excel-loving friends who can run VLOOKUP and macro circles around me. But unlike most people who use Excel for data analysis and number crunching, I enjoy it for the simplicity.
In fact, most of my spreadsheets have no formulas and some don’t even contain numbers.
Spreadsheets without formulas or numbers?! Blasphemy! Why even bother … right?
However, you probably know and love a few unconventional uses for Excel like creating role playing games or playing Super Mario World or Space Invaders. I just happen to know a lot of uncommon ways to use Excel with surprising results.
The most unconventional and best way I’ve tapped into Excel’s functionality has to be Experience Curating, though. In fact, it was so powerful that I spent a year writing a popular book about it.
Experience Curating is a three-part blueprint that empowers you to recognize, capture, organize, and share your most valuable moments. The first part builds the mindset that everything can be curated to benefit yourself and others. The second part integrates the six-step FAOCAS framework that makes any experience meaningful. And the last part applies the tools and best practices to grow actual curating currency.
I can’t convince you here that spending 0.1% of your time adding value to the other 99.9% through curating is worth it. And I can’t explore the nuances of the FAOCAS framework – Filter, Archive, Organize, Contextualize, Access, and Share – on Chandoo’s platform.
What I will do is show you how to use Excel to keep your most valuable experiences tidy, accessible, and sharable. What you use your curated experiences for – making money or personal finance mastery, improving your relationships, truly useful to-do lists, or world domination (for instance) – is up to you.
Using Excel to Curate (Even Excel Resources)
Since you like Chandoo, I assume you want to rock at Excel. Actually, I bet you’ve seen many Excel-related resources that you’d like to revisit or share with this community.
But it’s time to answer some tough questions like:
- Are you archiving those Excel-related blog posts, knowledge base articles, YouTube videos, and other experiences?
- Have you organized your Excel resources “experience elements” – the who, what, when, where, why, and how of an experience – in a logical and meaningful way?
- Did you preserve the context of the content creator and add your personal layers of valuable context?
- Can you access your Excel resources when, where, and how you want?
- Can you share your resources quickly and with attribution to the source?
It’s OK if you answered no to any of these questions. Follow these steps, or customize them for your unique needs, and you’ll be answering yes in no time.
- Define your curated spreadsheets’ goal(s): In this example, the goals of the spreadsheet are to capture, organize, preserve context, instantly access, and share (when necessary) your Excel-related resources.
- Determine how many worksheets you need. My default is just one worksheet so that I can quickly see, sort, and filter everything in one place. You, however, may want multiple tabs so you can do fancy formula and visualization stuff that I don’t even know about. The decision is up to you.
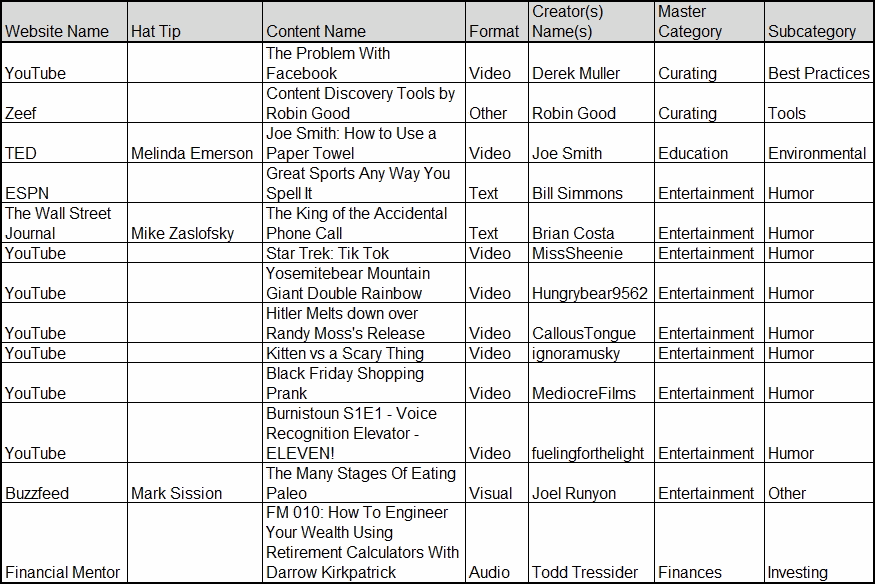
- Identify your sort and filter needs. Knowing how you want to sort and filter your workbook helps decide how many and what type of experience elements would be useful. Is sorting by tag or experience creator essential? Is filtering by resource topic category or subcategory important? Whatever column headers (a.k.a. experience elements) you need to slice and dice should be required columns. Everything else can be optional.
- Create a simple instruction manual. Each experience element should have a logical name, a clear purpose, pre-defined acceptable values (preferably with data validation), a realistic example, optional general notes, and be either required or optional. You don’t want to leave this critical foundation in your ever-changing memory or subject to interpretation. Fortunately, it’s easy to create an instruction manual in a separate worksheet. Check out my example if you want to see Experience Curating in action.

- Think about the visual formatting. My minimalist nature seeps into Excel as I use almost no color and little overall visual formatting. But I still contemplate the ideal margins, orientation, header, footer, print area, and printed paper size in case someone else might want a physical version. I also choose a column’s cell format (e.g., text, number, or date), font (I like 11 point Arial), and text alignment (e.g., wrapped or indented) that’s ideal for each experience element column.
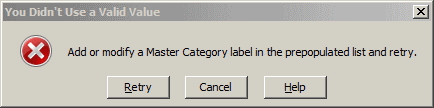
- Create a pre-populated list of labels for your required experience elements. Each pre-populated list lets me turn off my brain and rely on a set of labels that I determined with intention. I especially like data validation here so I’m prevented from entering a label that’s not part of my pre-populated lists. As a best practice, I also add customized error messages that prompt me to use an existing label or add a new one to the pre-populated list.
There are tons of best practices around this process in Experience Curating, but these six steps will let you curate any combination of topic and medium in Excel.
If only the millions of Evernote or Facebook users knew what they were missing when they don’t use Excel to curate!
Excel + Experience Curating = Awesome
What Chandoo does with Excel is magical.
What a master curator like Robin Good does with Scoop.it, Zeef, or hundreds of other tools is inspiring.
Now imagine combining the best of Chandoo with the best of Robin Good.
That’s what Experience Curating is all about.
It takes little energy and time. And since you already have Excel, you have no extra investment to make.
Pick a single topic you like and start curating it in spreadsheets. In fact, I’ll make it easy on you. Here’s your first resource to put in your new spreadsheet … and it’s about spreadsheets: Skilledup’s 133 Excel Resources: Tutorials, Guides, Add-ins, Templates, & Courses.
Need to expand the combination of your curated topics and mediums beyond spreadsheets and Excel? Just use another Experience Curating template, the Curated Topics and Medium Tool Decision Grid.
Spend two minutes now to curate this post so you or someone else can benefit from it later. The proven process of the FAOCAS framework can help if you need it.
Your experiences don’t just happen to you. They can make big things happen for you.
Preferably in Excel, of course.
For the comments: What other ways do you know of to use Excel unconventionally? What tweaks would you make to the Experience Curating framework to make it even more valuable with Excel?
Added by Chandoo: Thank you Joel
Many thanks to Joel for writing this article and sharing an interesting & powerful way to use Excel to make ourselves smarter, better & more awesome. Exactly the kind of stuff that gets me excited.
If you enjoyed the article & want to put everything in Excel, take a minute and say thanks to Joel. Also, check out his book for understanding more about experience curating.
Note about the links to Joel’s book: I am using my amazon affiliate link for Joel’s book. That means Chandoo.org make a few cents, if you choose to purchase it thru my link. I genuinely like Joel’s book & I think you will enjoy it too. I would have recommended it even with out the affiliate link.
About the Author
Joel Zaslofsky is the creator and author of Experience Curating. When he’s not enjoying nature, working on his Smart and Simple Matters show, or chasing his sons around the house, he’s cranking out useful stuff at Value of Simple. Stop by to download the free tools that he and countless others use to simplify, organize, and be money wise.


One Response to “How to create SVG DAX Measures in Power BI (Easy, step-by-step Tutorial with Sample File)”
My intention in this leave tracker, is to see other months instead of last 3 months of the year