
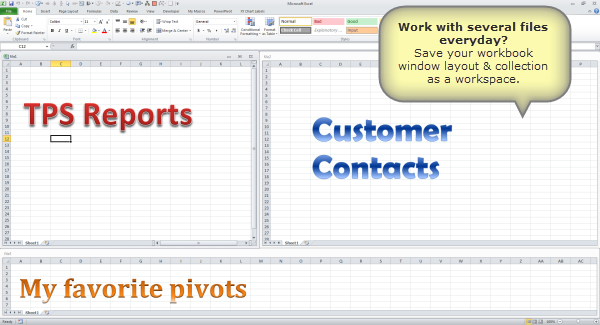
If you work with multiple Excel workbooks everyday, then here is a handy tip.
 Open all the files you frequently use together.
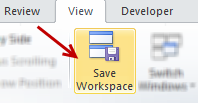
- Go to View ribbon and click on Save Workspace
- Give a name to your workspace
- Now, whenever you need to open all these files together, just double click on workspace file in your explorer.
- You are done!
Workspace saves not just file collection, but also window layouts. That means, if you like to arrange your Excel windows in a specific fashion, you can save this arrangement too.
Bonus tip: Use specific filter criteria all the time? Try custom views.
More tips on using Excel & shortcuts.
Do you use workspace feature?
I find workspace feature to be very useful when I need to work with multiple files, especially in cases like file comparison and consolidation. I can save the file layout as a workspace and re-open it whenever I want to resume the work.
What about you? How do you use workspace feature? Please share your tips & experiences with us using comments.


28 Responses
Thanks for this great Tip. 🙂
My Question: What if, the excel files location change on drive ? Still workspace support ? Or all the files needs to be saved on similar location and we cant moved their location in Future ?
That option is not availlable in Excel 2013 🙁 I really miss it.
I AGREE!! I CAN’T BELIEVE THEY TOOK THIS FUNCTIONALITY AWAY FROM US. I USE CERTAIN WORKSHEETS TOGETHER FOR DIFFERENT PROJECTS AND THE “SAVE WORKSPACE” OPTION SAVED ME TONS OF TIME!
HOW COULD IT BE GONE! (I CAN OPEN OLD WORKSPACE FILES (.xlw), BUT NOT CREATE NEW ONES.) THIS IS SUCH A PROBLEM. NOW I CAN’T UPGRADE MY OLDER EXCEL SOFTWARE!
PLEASE, PLEASE, PLEASE BRING BACK “SAVE WORKSPACE” TO EXCEL 2016 AND FUTURE VERSIONS!!!
This is an excellent option which I was not aware of till now. I’ve a challenge here. It is not preserving the zoom. i.e., I’ve save the workbooks with different zoom levels (75% for one, 85% for the second and 90% for the third) to show at the time of opening. When I use this option, it is opening with 100% zoom. Is there anyway to preserve everything including the zoom?
Thanks and regards,
Pradeep D
I have not used the Work Space feature, but I’ll be looking for opportunities now. Thanks for the great tip!
Never heard of this item
Hi,
Work with several Excel files everyday, These is very use full creation. It’s very useful one. Thanks lot.
Thanks for this great tip.
I m using 4 excel workbook at the same time for judgement of order placement.
1. for getting data from 3 sheets ( vlookup)
a. for 3 month stock
b. for monthly sales and purchase
c. back order from supplier
I urgently need help. I’ve been working on excel for a while which got me deceived into believing that i’m very proficient in use of excel. well, i decided to push the limits and designed a prototype software for business analysis using excel and presented it to a prospect. They liked it and requested for a full scale software to manage their entire business processes from prospecting to printing and sending reports
The software is supposed to be shared by multiple users (say staff) and will be hosted later on a website; this, for me is quite advanced and i’m quite skeptical of excel’s ability accomplish these. I need some some help and advice on whether excel can function as a full scale database and its limitations. Pls respond ASAP. Thanks
This is simply awesome!
I have been working on excel for like years and have broken heads and this is like a one click solution.
I am kicking myself for not even looking at the ribbon seriously!
i’m not also not so sure if this is risky regarding the volume of task to be entered into this software
I just knew this wasn’t going to be available in Excel 2003. I’m the only one in the office who still has 03, everyone else has 07…and I’m the only engineer in the office who could use some 07 features in work life. Oh the irony.
But it is File>Save as workspace. I NEVER noticed it before. Thanks for the tip ^_^
Thanks Jasmine (and Chandoo)! I use 5 worksheets regularly every day and I’m the only one w/ ’03 as well so I figured I was out of luck!
Very good option for daily use of multiple excel sheets.
How do I get the 95 tips and tricks with excel?
Awesome!
I’ll try it later since I work with multiple Excel files EVERY DAY!!
While using two screens and working in workbook space view, I find that I cannot move any of the workbooks onto my other screen. I would like to move them from one screen to another! Also how can I undo workbook space?
Thanks for your help!
Thanks for this awesome tip, i never used it before!
Good Work,Keep Posting
You can’t save the current layout of all windows as a workspace. The Save Workspace command is no longer available in Excel so you won’t be able to add it to the Quick Access Toolbar. However, you can still open a workspace file (*.xlw) that was created in an earlier version of Excel.
This is a tip related to the above. My method for getting to the top 20 EXCEL files that I most often use:
The default file folder for my EXCEL contains 20 shortcuts to the actual files. I prefix each shortcut name with a number so that they get sorted in the order that I most often use. For example, it could look like this:
100 Shortcut – Checkbook 2013
101 Shortcut – Passwords
102 Shortcut – Todo List
etc.
Great, I just “upgrade” if that’s what you want to call it to 2013, I have finally decided that the 3 files I open everyday has got to be an easier way. So search google and low and behold Workspace. Thanks MS. But wait, heyy that’s not cool Where the heck did you take workspace MS? Good job bone head. Just like telling everyone that MSNQuotes doesn’t work either.
Microsoft took this away with Office 2013. They’re opting for more shallow-thinking users, I guess. This was a powerful feature I used a lot. We can only hope someone comes up with a product that satisfies the more complex spreadsheet user.
@Car53, Jason
In 2013 “Save Workspace” is under the View tab, Save Workspace
No its not
If you look at MS Office’s website, they distinctly state that for the 2013 version the Save Workspace button, option, function, feature has completely removed from the program. Stupidest thing they could have done IMHO. Only the versions prior to the MS Office 2013 have it.