
Here is a quick home work on excel conditional formatting.
Lets say you have data as shown below to left and you need to show zebra lines whenever the value changes (see right).
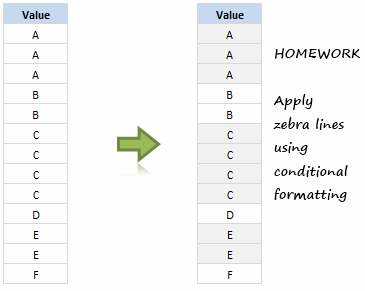
Your home work is simple. Just figure out how to write conditional formatting rules to add zebra lines.
The data set is here.
Go..
PS: Problem inspired from this post on Chandoo.org forums. Don’t cheat.
PPS: Here is some beautiful help on conditional formatting.


82 Responses
I Solved it 🙂
=mod(row(),2)=1
This will work
if(mod(code(a2),2)=0)
Use this formula in conditional formatting.
@Deependra… Post your solution…
@Amit… that formula will not work if the data has values other than ABCD,…. in that order.
siimple!
In conditional Formating use the rule: if A2A3
siimple!
In conditional Formating use the rule: if A2 “not equal” A3
All I have done is cell not equal to B3 then pasted down.
If they do not match it highlights.
Is that what you’re asking?
Once I figured out that Excel treats formulas in Conditional Formatting as array formulas, it was straightforward.
=MOD(SUM(IF($B$3:B15=$B$2:B14;0;1));2)
@Chandoo:
In that case, do this:
C3 =1
C4 = if(B4=B3,C3,C3+1)
This will give us a numbered list, starting 1, that will appear alongside the original list. Then use the formula previously written to do conditional formatting based on values in column C.
Hi,
Well, I used a helper column (May be, we can do it wothout one, but for now, I can only think this).
Formula for Helper column F: =IF(D3=D2,F2,F2+1) F2 is just blank or we can make it zero. This formula is like a counter, each time it sees a change in the data it increments 1 to the count. Effectively, that gives us count of unique values from the data set we have.
Try this formula : =MOD(F3,2)=1…Then select a format
=MOD(F3,2)=0…then select a format
And we have the zebra lines. Hope this helps. Looking forward to a much more easy solution. I’ll keep trying for that as well.
Jan,
When I tried your formula, all the rows got colored. Did I miss anything?
I think people are coming up with Kewler ways..If my Data set is in D3:D17 I simply put =+IF(D3=D2,E2,NOT(E2)) which is kinda similiar to Varaks Solution…Where in corresponding E cells(Helper Column)… I have Trues and False Populated ….:P …..It sure changes with every change in data but then uses more realestate and Is clumsy :(…Ill see the better solutions when I get back home…Btw Chandoo..Great Blog I must say…I never had the chance to thank u…You make most of my day easier and creative….
Holy Crap!!!Chandoo Came with the Same solution…I guess I can see the link for better solution :P…I just saw the solution link..And their it was :)…No doubt I am getting intelligent…Beer on me guyz…Time for my Nirvana…
You could use a formula to count unique values within the MOD function (no helper column required). It does require data set to be sorted. Assuming your data set starts in A1:
=MOD(SUM(IF(FREQUENCY(MATCH($A$1:A1,$A$1:A1,0),MATCH($A$1:A1,$A$1:A1,0))>0,1)),2)
@ Luke…Super Dude..Saved My Real Estate Property..and then it seems it is self populated..In the other Solutions the helper Cells have to be dragged down…You can hav Ma Beer… 😛
@Varak
It depends on how you select the area when entering the conditions. If you selected from the top down, it would colour all the cells.
I had selected the entire list, starting from the bottom when I entered this. Must be a habit from my days selecting with the mouse 🙂
Of course, this is a lot simpler with a helper column. 😉
I didn’t get it!
Why we need this stuff of formula, helper colkumn and so on?
As I posted above, it’s enough to write the condition formula ” B3 not equal B4″ and set pattern of cells B3,B4… to change if condition is satisfied. For me it’s enough, isn’t it?
surprisingly my Ex2003 accepts an array formula for conditional formatting:
=1=MOD(SUM(1-($B$3:$B3=$B$2:$B2)*1),2)
And if it would not, it should accept a named formula “=MOD(SUM(1-($B$3:$B3=$B$2:$B2)*1),2)” entered as a named formula while acitive cell is in row 3.
Thank you so much for this solution, this was a huge help. I’ve used this several times. Both options work perfectly!!!
@Chuck Bily
IF one wants to have all “A” grey and all “B” white, and then “C” grey again – he needs such a formulas. Your solution makes just first “A”, first “B”, first “C” grey (and if there are unique letters one by one – they are all grey). It could work with underlining cells instead of filling them. With a lot of data your solution would be more effective: less calculations -> less time required to calculate a spreadsheet. But there is rather little fun in finding such a solution 😉
This has been something I’ve occasionally really wanted to do, but couldn’t figure out (at least in the time available at the time). Thanks. I really like Jan and Magda’s variations on doing it with mod and sum on the compared array ranges. Selecting an entire table, then using changes in values in the sort column to change colors for all cells in the row(s) worked like a charm.
Now, what I’d *really* like to do would be to be able to identify the primary sort column and do the format change based on *that* column, but the Intarwebs is not yielding a good way of determining that piece of information.
But using SUMPRODUCT is so much nicer 🙂
=MOD(SUMPRODUCT(–(B3:B21=B4:B22)),2)
And if you want to make it more generic you can set the range using an OFFSET.
=MOD(SUMPRODUCT(–(OFFSET($B3,0,0,COUNTA($B:$B),1)=OFFSET($B3,1,0,COUNTA($B:$B),1))),2)
Its so simple..
Select Cell D3,
Go to format > conditional formatting –> choose formula is –> =B3D3
and set format conditions
now the moment it differs from original set it will highlight 🙂
Hows it Chandoo !!!
Regards
Rohit1409
B3D3
is
B3 less than sign greater than sign D3
It looks simple. But I am not sure whether my below formula is what you expect.
I just did =A1B1 and it works for me.
Regards,
Ramnath
Opps! sorry. Not Equal to sign is not appearing on the screen.
So it is =A1 (Not Equal To) B1.
Already solved and posted back in March – post #64 under the conditional formatting article!
In a nutshell, I used a helper column too: Formula for Helper column F: =IF(D3=D2,F2,F2*-1), F2 can be 1 or -1. This will alternate the values in the helper column between 1 and -1, just run your conditional format against that.
I like it as the helper column formula is very light, and the conditional formatting criteria is even lighter!
The MOD solutions are elegant – it’s not as neat to have to create a new column – but they have to run calculations against the entire dataset for every cell. My guess is that with very large datasets, this could be hard work for excel!
If you want to run the stripes across multiple columns, this solution needs no more calculation, either.
@Simon P
I agree with your conclusion, helper columns are computationally lighter, and easier to troubleshoot too!
To cut to the bone, all you need in the helper column (A3)is =IF(B3=B2;A2;NOT(A2)).
That will return either TRUE or FALSE, and is easy to evaluate against in a conditional format.
For B3:
Formula is: =A3
Now, THAT’S lightweight!
Ok people, I am really lost. I have tried all your formula and cannot get the results. Can I ask for more details on how you were able to make it work??
I hve used a helper column to include the following formula
“=IF((IF(B3=B4,1,0))=1,D3,(1-D3))”. The formula is entered in the helper column for Row 2 onwards. Row 1 contains value ‘1’ in the helper column.
What it does is, the moment the value changes in row, it toggles the value to either of 1 OR 0.
Then the conditional formating formula is applied for all ‘1’ thereby giving the ZEBRA lines…
The explanation above is probably not very good… Maybe I can attach the actul XLSX file
Hi,
Please see Chip Pearsons site for some excellent examples on Data Validation:
http://www.cpearson.com/Excel/Duplicates.aspx
Not my solution but these worked examples are great!!
@Peter Ramirez
for Ex 2003
-download Chandoo’s file
-open and select cell B3
-select menu Data->Conditional Formatting
-select option Formula is (instead default of Value is)
-copy formula : =1=MOD(SUM(1-($B$3:$B3=$B$2:$B2)*1),2)
-paste
-select format (grey background)
-confirm
-copy active cell
-select area to be formatted
-then Paste special-> Formats
@all.. here is a little secret. There is a hidden sheet in the data file which has solution in it. Just unhide the sheet to see how I would have solved this problem. Not the most optimum way, but certainly easiest to understand or implement.
The url again: http://img.chandoo.org/hw/zebra-lines-when-value-changes-data.xls
@Magda, Jon, Ian .. Interesting solutions. Can you elaborate the logic behind your formulas and tell us why they work?
Hi , I’ve tried to. But still can’see submitted post.
Hi,
third trial resulted in a comment:
“Duplicate comment detected; it looks as though you’ve already said that!”
A formula “=B2=B3” results with TRUE if cells are equal or FALSE if they aren’t.
Array formula “=B$2:13=B$3B14” results with a table {FALSE/TRUE/TRUE/FALSE/TRUE/FALSE/TRUE/TRUE/TRUE/FALSE/FALSE/TRUE/FALSE}
Multiplication =(B$2:13=B$3B14)*1 makes Excel to treats FALSE/TRUE as numbers (quite often Excel treats TRUE as 1 and FALSE as 0 – but not in this case) and turns an array into {0/1/1/0/1/0/1/1/1/0/0/1/0}.
=1-(B$2:13=B$3B14)*1 makes {1/0/0/1/0/1/0/0/0/1/1/0/1} (I could simply use B$2:13B$3B14)
=SUM(1-(B$2:13=B$3B14)*1) just counts how many cells values an the table are different from cell above and if equal values are one by one – formula gives the same number. MOD – to distinguish even and odds for conditional formatting
Sorry, in former post should be:
(I could simply use B$2:13″not equal”B$3B14)
and in next line I mised one colon:
=SUM(1-(B$2:13=B$3:B14)*1)
I’ll give it a shot.
=MOD(
SUM(
IF(
$B$3:B15=$B$2:B14;0;1
)
)
;2)
The IF() returns an array of numbers. A 0 is added to the array each time a cell is equal to the one above it, and a 1 is added for each time it isn’t.
TIP: Conditional formating treats every formula as an array formula!
The SUM() takes this array as input and returns the current sum.
The MOD() then returns the residual of division by 2. For odd numbers this is 1, which is then interpreted as TRUE by the conditional formating. For some reason using ISODD() does not work here!
This is a quite calculation-intensive way of solving the problem. It is not suitable for large datasets, as it gets more intensive for every added line of data. Also, it is impractical, but it was a fun challenge!
I have numbers in cell (A1) 9845078861 which is =56 (9+8+4+5+0+7+8+8+6+1) = 56
would be great if you could advise me to sumup/total with the help of Excel Formula or Functions.
Thanks & Regards,
Swamy
@Chaluva
Try this UDF
Copy and paste it into a Code Module in VBA
Function SumDigits(Target As Variant) As Long

  For i = 1 To Len(Target)

    If Mid(Target, i, 1) >= 0 And Mid(Target, i, 1) <= 9 Then
      SumDigits = SumDigits + Mid(Target, i, 1)
    End If
  Next
End Function
To use it simply enter =SumDigits(A1) or =SumDigits(987654321)
Hi Chaluva…
You can use SUMPRODUCT to get this. Assuming your number 987654321 is in cell B10, write this formula in an empty cell:
=SUMPRODUCT(MID($B$10,ROW(OFFSET($A$1,,,LEN($B$10))),1)+0)
and press enter.
I have not looked into it yet, but I would want to create a similar version that also works on records filtered on the same column, for example show only records with B, C and E and have C in another background color than B and E
Hi,
Chandoo, nice test as always. Simple but imaginative.
I have not yet looked at the suggested solution, here’s my effort:
I used a helper coulmn (A) and used the following formula to increment by 1 with every change in the contents of the cell in the same row of the adjacent column B, =IF(A3=A2,A2,A2+1) [A2, the cell adjacent to the header, “Value”, is left blank] and copy down to cell A15.
I then highlighted cells B3 to B15 and used the following formula in conditional formatting =ISODD(A3), this will give TRUEs and FALSEs down the list, then selected the Fill format Light Grey.
You could do away with the helper column by copying the incrementing formulas except for the equals sign and using that instead of A3 in the ISODD formula.
This is my clumsy effort!
Hi all.
I want the farmula for S.no in column A till the data in column B. (if you run the macro the S.no should display in coloumn A til where the data end in colunnmn B.
Hi,
Just stumbled on this site.
A solution WITHOUT a helper column
=IF(B3=B2,A2,IF(A2=1,0,1))=1
Then format for the colour that you want.
Clemens
@Clemens Neat!
But I note that …..,(IF(A2=1,0,1)…… is always 1. Is there any reason why we can’t just substitute that nested IF with 1?
It seems to give me the same result.
@Shmuel,
There’s an error in my initial post.
I just realised that my formating can be achieved with the given formula only if there is a helper column (in the case of the formula the helper column should be in column A.
The formula, at A3 shoudl be IF(B3=B2,A2,IF(A2=1,0,1)). This should be copied down to A15
The formula for conditional formating for the range B3:B15 should be =B3=1 and apply the color to this.
As per the homework, the colouring can be achieved by VBA, not sure if that would constitute a valid answer to the original question….
Clemens
Hi, Am trying to concatenate Date & Amount and looking with the help of Vlookup as dates may vary max by 2 days i could not get the accurate answer.
FYI… (formula Used for Date =TEXT(C2+1,”DD.MM.YYYY”),=TEXT(C2+2,”DD.MM.YYYY”) & =TEXT(C2+3,”DD.MM.YYYY”) to make constent.
Would be a great if you could come up with some logic or function (VBA Codes) which helps me to overcome this issues.
Requirements :
Source data’s are coming from two different applications namely ABC Aopplication & XYZ Application for which we need to remove the duplicated data in XYZ application (we are
not removing from ABC application)
Date range in the sheet ABC application may vary maximum by 2 days.
FYI… 10th dated (ABC application) amount may come in XYZ application
on 10th ,11th or on 12th)
Please note: same day we will not get two or more same amounts
Thanks & Regards,
Chaluvarayaswamy
@Chaluva
To concatenate a date and a $ amount try something like
=Concatenate(“Some words “, text(C2,”DD.MM.YYYY”), ” Some more text “, C3,”$”)
where
C2 is a Date
C3 is an amount
Your seperation delimieter may be different depending on your language version of Excel.
Hello Chandoo….
You may be interested to find MrExcel’s challenge of this months posted at http://www.mrexcel.com/Challenge2011/challenge_42011.html. Also, to demonstrate the excel’s simples capability in predicting the lotto numbers, I’ve submitted my entry under the link <iframe src="http://r.office.microsoft.com/r/rlidExcelEmbed?su=5455323543535607345&Fi=SD4BB533DBFB43DE31!107&AllowInteractivity=True" &AllowTyping=True&activecell=smartpick!a35"width="402" height="450" frameborder="0" scrolling="no".
I’d like to get your critical comments about this.
Mohan:)
Hi Thanks for your reply,
To make you better understanding, I have received an amount of 100.00 on 11/04/2011 (orginal amount) in a spread sheet and the same amount of 100.00 may received in another spread sheet on 11/04/2011 or 12/04/2011 or on 13/04/2011 (duplicate entry 100.00 in any of these three days)
Requirements:
-> Need to remove the second entry (entire row) which is 100.00 coming on 11/04/2011 or 12/04/2011 or 13/04/2011.
Please note: in first spread sheet we will not receive the same amount of 100.00 in any of these dates again.(11/04/2011 or 12/04/2011).
The same amount of 100.00 may come on 13/04/2011 which is orginal amount in first spread sheet. This 100.00 need to be removed in sacond spread sheet which may come on 13/04/2011,14/04/2011 and 15/04/2011.
I would expecting a Excel Formula or VBA codes to overcome the above situation.
Early response would be appriciated.
Thanks & Regards,
Chaluvarayaswamy
=IF(CODE(B3)=CODE(D3),1,0)=0
convert each letter to a number, compare and format based on weather they are the same.
=MOD(SUM(1/COUNTIF($B$3:B3,$B$3:B3)),2)=1
I like this solution because it doesn’t require the helper column. I don’t know how to explain to colleagues why/how this formula works. Can you or someone else explain?
Thanks!
@Diana
You may want to have a read of this post: http://chandoo.org/wp/2011/12/08/formula-forensics-no-005/
Use the formula in conditional formatting based on formula
=if(a3<>a2,true,false)
and in the format if true option select the desired border
Regards,
Murali M
Oops the not equals symbol is not showing
if(a3<>a2,true,false)
Regards,
Murali M
ps: with edits by Hui
I learnt everything on xl reading your site only.Thanks for another great post.
i dont git it.
why do dis stuff have to be so different?! 🙁
@Joann
What stuff is so different and to what is it different?
=IF(MOD(CODE(B3),2),TRUE,FALSE)
This will get ASCII code of the cell value and mod by 2. B3 is ‘A’ –> ASCII code = 65 –> TRUE –> highlight
nooo one has responded to my post please help ,
@Sam
Why is this question here when your post is over at http://chandoo.org/wp/2008/06/09/what-the-if-learn-6-cool-things-you-can-do-with-excel-if-functions/ ?
Simplest conditional formating formula is =isodd(code($B$3:$B$15) )
Guys need serious help.
Cant get a macro to work. Want to force employees to fill specific infor in form and if they have completed the form attached form to an email.
I think the exit sub is a problem …but dont know what else to use…Please please help…
Got the following code but just not able to crack it.
Code —-
Sub Mail_workbook_Outlook_2()
If Sheets(“Sheet1”).Range(“D7”).Value = “” Then
MsgBox (“Pls enter value in D7”)
Cancel = True ‘cancels the save event
End If
Exit Sub
‘Working in 2000-2010
Dim wb1 As Workbook
Dim wb2 As Workbook
Dim TempFilePath As String
Dim TempFileName As String
Dim FileExtStr As String
Dim OutApp As Object
Dim OutMail As Object……then the code to attach file to email which works perfect with out the checking code
end with
end sub
=MOD(IF(MATCH(A3;$A$2:$A$22;0)>MATCH(A2;$A$2:$A$22;0);MATCH(A2;$A$2:$A$22;0)+1;MATCH(A2;$A$2:$A$22;0));2)=0
Go to the second value in the list and Cond. Formatting > Use a formula > copy this formula there, then perform. Then go pick that value and click on format painter and paint the whole list.
Note that the remainer of the mod is 0, if it was 1 then it would format the second and below cells of the first group but the first one. Since we cant compare the first cell with another, it has to be manual, or the best leave it unformatted and make the remainer of the =MOD formula 0…
Hi,
I have 3 columns, A, B, C with manual entries values. A+B always should be equal with C, but the C value is a manual entry of the amount and not a sum of A and B. I want to use the Conditional formatting for the entire C column to highlight the C cells in case A+B not equal C . Please advise. Thanks!
@Ana-Maria
I have assumed your data starts at C2 and goes down
Select your Data from C2 to Cx
Goto Conditional Formatting
New Rule
Use a Formula
=A2+B2<>C2
Select a Format
Apply
Thanks! It works!!! 🙂
Zebra:
=MOD(SUM(1-(A$2:A2=A$1:A1)),2)
or
=-1^SUM(1-(A$2:A2=A$1:A1))<0
Hi
I used a helper column for this.
=IF(C2=1,IF(B3=B2,1,0),IF(B3=B2,0,1))
After that based on col C did conditional formatting where C3=1.
Amritansh
=OR(B3=”A”,B3=”C”,B3=”E”) works and can be copy and pasted down the column… works for me…..
Helping column F3 with =IF(D3=D2;F2;NOT(F2)*1) , fill down to F15 and conditionFormats on selected D3 to D15 with only the formula =F3
Choose color.
Great solutions ;O)
the provided solution (on the hidden sheet) works well for me. HOWEVER, it is not useful because each time i analyze the values, i will be using the autofilter. i have a report with 250 rows amongst 10 users and i want to evaluate each user individually. when i use the autofilter on a single persons name, the colors do not re-sort themselves based on the rows shown. this leaves different values that are next to each other with the same highlight/non highlight. is there a way to manipulate this formula so it will be accurate when i use my autofilter and am not looking at the entire data set?
Is there a way to apply the conditional format to the row rather just in the first cell of the row as shown in the example?
Any count of data:
Step 1: go to data>short> a2z
Step 2: apply to adjacent row ” =IF(A3=A2,B2,NOT(B2))”
Step 3: again Goto Home> conditional formatting>highlight text rule>Text that contains> (put True)
Step 4: apply the filter
Step 5: Select True and mark color gray to original line
thats all .. Arranged and zebra lining
in addition to it count also done (i needed in my project)
We can try below formula in the conditional formatting.
data is present in Column A.
=IF(MOD(SUM(IF(FREQUENCY(MATCH(A$1:A1,A$1:A1,0),MATCH(A$1:A1,A$1:A1,0))>0,1)),2)>0,”TRUE”,”FALSE”)
By this method u don;t need a helper column.
But for the above method to work, need to have the data sorted in a particular order.
Hey all,
sorry I am a bit late and I guess nobody will read this post anymore but I just stumbled on it tonight and was excited trying to solve the problem. I am using Excel 2013 so maybe there is a difference in handling some formulas than in earlier versions. In my opinion, this homework can easily be solved when you think about the letters as numbers. In Chandoos example, all the cells containing a letter that can be translated into an odd number (A=1, C=3 and so on) where coloured grey. Therefore we just have to translate the letters into numbers and colour the cells accordingly.
My approach was therefore, without using a helper column:
Mark (b3:b15) –> conditional formatting –> new rule –> use formula…
My Formula is: “=isodd(code(b3))”
If the formula is true, the colour of the cell should be grey, otherwise nothing happens. The formula worked well without any problems, and when I change the letter the colour of the cell adapts automatically (in case it is a letter that is translated into a different kind of number than it was before).
Just wanted to post my solution, would be happy to receive any kind of feedback. 🙂
Have a great week!
@Florian
I read every new comment twice a day so don’t fear, it has been noticed.
In regards to this my only concern will be if the data has for example
Dogs
Donuts
Dumbo
Frogs
Felines
Fences
Because there is no E’s and D and F are both even, then they will be shaded the same
where as
Dogs
Donuts
Dumbo
Elephants
Frogs
Felines
Fences
would be ok
Hey Hui,
thanks for replying fastly! I see the problem with my approach. Thanks a lot again, great to receive feedback!
Have a nice week.
Florian