
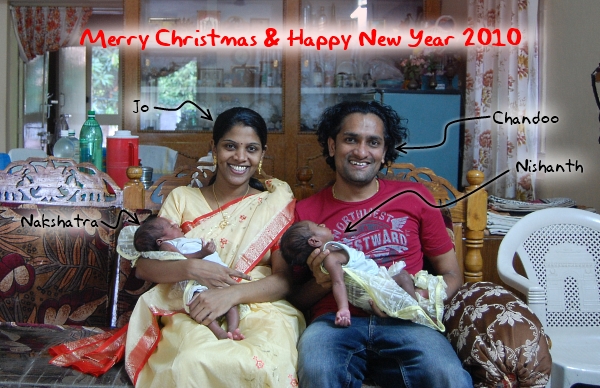
Christmas and New year have always been a magical time for us. Even though we end up being in 2 different countries for most of the Christmases, we always cherish the time. It has a special romantic significance too, I proposed to Jo shortly after new year in 2001 (and did it almost everyday until Jan 25th when she finally couldn’t take it any more 😛 ). We wish you a very pleasant Christmas and New Year 2010.
Holiday Posting Schedule on PHD:
Nowadays it is common for any shop to tell their customers what the holiday opening hours are. So in that spirit, I want to let you what we will be posting on PHD between now and Jan 4th 2009.
- 24 DEC 2009 – Post on using DATE formulas to find out popular holidays
- 25 DEC 2009 – No posts (its Christmas day, I am still asleep)
- 26 DEC 2009 – No posts (its weekend, I am out drinking)
- 27 DEC 2009 – No posts
- 28 DEC 2009 – An upgrade to the Indian Mutual Fund Tracker Excel Workbook
- 29 DEC 2009 – My Review of PowerPivot Feature in Excel 2010
- 30 DEC 2009 – Best Posts on PHD in 2009
- 31 DEC 2009 – No posts
- 01 JAN 2010 – No posts (I am calling my friends and wishing them a good year ahead)
- 02 JAN 2010 – No posts (its weekend, I am out running)
- 03 JAN 2010 – No posts
- 04 JAN 2010 – Announcement of Visualization Challenge #2 Entries and Poll
Forums:
I will not be participating much on the forums. I hope that is the same with our active members like Hui (thanks Hui, btw). But I will be checking them once or twice everyday, so go ahead and ask a question if you are stuck. I will try to help you between a Christmas lunch and nap.
Online Store:
The store is open, all thru. Please make any purchases you wish to before Christmas to avail our Thanksgiving sale offers. If you have any problems please get in touch with me on my gmail (chandoo.d @ gmail.com) or phone (+45 5038 4743).
Email:
Please expect some delays if you email me. I will be snoring more than 8 hours a day during the next 2 weeks.
There you go. Now you know what you will miss if you are away. Don’t worry if you are on a big vacation. Just sign up for our RSS Feed or Email Newsletter and the content will be waiting for you when you get back.
Once again, we wish you all a very happy Christmas and New year. 🙂


27 Responses to “Merry Christmas & Happy New Year 2010”
huh... you could proof read the post hundred times and still miss a silly mistake like this...
Read "PHD between now and Jan 4th 2009." as "PHD between now and Jan 4th 2010."
Chandoo & family
All the best for Xmas & New Yr
I'll still be checking the forums and responding regularly, between drinking and celebrating ...
Happy Holidays and best wishes for you and your family on 2010!
Merry Christmas and Happy New Year !!!!!!
to you and your family.
Merry Christmas and prosperous new year fto you and your family.
And thank you for the wonderful tips posted in 2009.
That in 2010 many other tips can be made.
Merry Christmas and Happy New Year !
from Perú
Dear Chandoo,
thank you for this blog which is a great source of inspiration for me. Nice to see you and your family so happy. A wonderful christmas and a happy new year to you and Jo, Nishanth and Nakshatra.
Phil
@ Hui: You really are an Excel Ninja. 🙂
@ Chandoo and all, Happy Christmas!! (and other holidays).
Merry Christmas and a Happy New Year to you and your lovely family! I can't believe you take the time to help us all because both you and Jo have got your hands full. 🙂 Enjoy your little ones and may they be good little sleepers for their parents!
Hope you enjoy a well deserved break Chandoo. We all look forward to seeing you again in 2010. Merry Christmas to you and your family tomorrow!
Thanks for a fabulous Blog, and a fabulous Xmas card as well; Visually, you always impact!
Have a great time now, and of course next year and the years after with the little 'juniors"!
You have also french fan
Merci, Merci beaucoup
Joyeuses fêtes à toi et à ta famille. tes tutoriaux sont precieux, et Excel me parait beaucoup plus facile.
Joyeux Noël... for you and your happy family. Take care of them, they are so precious 🙂
Have a great time celebrating and read you next year.
Nice looking family (well 3 out of 4 ain't bad! he he).
All the best for 2010.
Hai Chandoo,Mrs Chandu,Nakshatra and Nishanth,
Merry Xmas and New year
@all.. thank you so much for your wishes. 🙂
Wow Chandoo,
Happy New Year to you and your Family
Nice display of 2 little sparks across columns
@Santosh... the best combo chart that you can make 😉
Dear Sir,
thank you for this blog which is a great source of inspiration for me. Nice to see you and your family so happy. its great to listen ur story for CAT on pagalgay.com.......
great man indeed!!!!!!!!!!!
Hi,
Nice templates! I ordered the set... Waiting for you to accept order so I can download...please check paypal... thanks... Nice work>>>
bill
Chandoo,
Love the pic of your family. Excel-wise, I'm convinced you're partly insane, but in a good way!
Thanks for pushing me further in Excel.
Sir,
Have you done any tools on Excel for using with AutoCAD application for eg:"BLOCK" counting and analysing such type of data on 2D drawings(Electrical).
Hey chandoo, Visitng your site after 4 long years :). We had met last at IIM Indore Iris 2006
Nice to see all these stuff and seems you are really making lot of people awesome at Excel
Cheerz
Lijo
Hi Chandoo, I saw an article in.msn.com today, regarding your mastery with excel and the way you are guiding others to excel in MS excel, it is inspiring! By the way I am also from Vizag, H B Colony! I am going to buy your project management excel suite.
Thanks, Bhaskar
Hi Chandoo, Nice to found this website for Excel hunters one among of myself. I learnt new things from this site and still i anticipate somany new things . I request youto give me your Email ID to request our doubts. I had much doubts and i have bid of knowledge in excel too. I want to be MVP likes you... So i leave this page with expectations... Have a Great days ahead with your family..,
Hi Chandu,
My name is Anvesh and I am an MTech graduate from IIT M. I am working as business analyst in Mumbai. I dont know much of Excel and I am going to start learning here. Since I am also from Andhra, I am very happy that you are running this site successfully. Particularly mana vallalo entrepreneurial spirit thakkuva. So role models thakkuve (unna Satyam okkati poyindi 🙁 ) I am very proud of you and I hope I will find an interest in life like you did.
Your family looks cute. Congrats, best wishes and thank you.
Anvesh