

Ok, so you have that neat little excel report ready and now you want to share it with your boss or client in a PDF format. So how would you do that?
- The best option is to upgrade to SP2 of Microsoft Office 2007 (download the service pack 2 from office update) and then use the “Save As PDF” feature provided by MS.

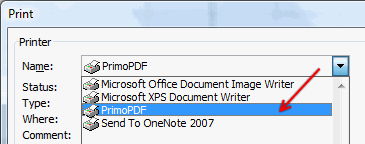
- The next best option is to install primo pdf. It is a free software that will create a new printer called PrimoPDF. You can print excel files to this printer and then it creates PDF files and places them in a location of your choice. I like Primo PDF alot and use it from Office 2003.
- The third option is to install OpenOffice.org and open the excel file there and use the save as PDF options. This can be a little messy as openoffice tends to spoil the excel look and feel when you open the files in openoffice calc application.
- The fourth option is to use one of the online conversion tools (they often messup the layouts) like Doc2Pdf. The annoying part with this service is that, you need to tell them your email id so that they can mail you the PDF when it is ready. There are few services where you can download the PDF online.
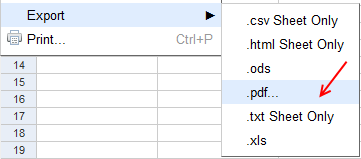
- The fifth option is to upload the excel file to google spreadsheets and use the export to PDF feature of google spreadsheets. This is good if your excel file has very little formatting and not really complicated. As google spreadsheets doesnt have lots of features that are in excel, you might see broken content, alignment and formatting when you try to open an excel file there.
- If you are using MS Office on Mac, then you have it easy. Just hit the print button, select the PDF option and you have the PDF ready.
Have I missed any Excel spreadsheet to PDF conversion methods? What is your favorite way to convert spreadsheets to PDF?
Related: Excel productivity secrets – part 1 & part 2


67 Responses
I use PDFCreator since it can save, print, email the generated PDF.
Works fine as a printer.
See it @ http://www.pdfforge.org/
For a few years now I’ve used a program called CutePDF that’s very similar to PrimoPDF. I’ve tried both and found CutePDF to be a little easier to use.
I have been working with Bullzip PDF Printer for quite sometime (previous used CutePDF).
There’s a great article on this subject here:
http://www.techsupportalert.com/best-free-pdf-writer.htm
There are probably dozens of CutePDF/PrimoPDF freeware PDF printers available across the web. There’s another called PDF Creator which has the advantage of being accessible to VBA automation.
Ken Puls has several web pages relating to automation of PDF Creator at http://www.excelguru.ca/taxonomy/term/21.
Maybe it’s too obvious, but I use Adobe Acrobat 8
Hi;
I’ve been using for some time pdfcreator (http://www.pdfforge.org/), which is freeware. It has some APIS to be used inside EXCEL VBA, to automate the process of creating pdfs, not only can be converted while printing, but also automated with some simple macros.
Thanks
@Dustin: cutePDF… I didnt know about this.. thanks for telling us about it…
for others: the link is http://www.cutepdf.com
@Lincoln: yeah, but this post is meant for ideantifying the free or really cheap alternatives to generating pdf files from xls files.
Personally, I’m a much bigger fan of Sourceforge’s PDF Creator. It’s free, and works much like PrimoPDF. Where PDF Creator shines is that it is accessible from VBA so you can automate the whole thing. After all, why click print when you can have Excel do that for you? 🙂
If you’re interested in some code samples, I’ve got a bunch on my site: http://www.excelguru.ca/node/21
I also blogged some time ago about why I prefer it over the MS Add-in. You can find that blog post here: http://www.excelguru.ca/blog/2008/01/03/office-pdfxps-addin/
CutePDF or PDF Factory/FinePrint. I prefer CutePDF but PDF factory can do things CutePDF can’t (and vice versa).
Anyone have a comparison of all of these PDF creators? I use doPDF. It installs as a printer, and makes a PDF. Sounds the same as everyone else’s?
At work I frequently publish my polished Excel reports to PDF for distribution. Alas, I am forced to use Acrobat. Ah, well. Question for anyone.. My corporate reports include a very nice logo image that looks fine when printed from Excel, but the conversion to PDF renders it as a smeared mess. Does anyone know how to preserve the quality of images? I have BMP, GIF, JPG, and PNG versions available, but all of them come out looking very unprofessional in PDF. I have tried twiddling the quality settings in “Acrobash” to no avail.
I use Microsoft Office 2007 Add-in to save excel as pdf
http://www.anypdftools.com/free-excel-to-pdf-creator.html#155
@Ken Plus: thanks for the links. I really liked your article on automating excel to PDF conversion.
@JoBrad: All the tools recommended here (primopdf, cutepdf, pdfforge etc.) have the basic capabilities that satisfy pretty much any day to day need. If you are in to professional printing or need to control the layout very tightly, my suggestion would be to try one of the commercial apps like acrobat. They are lot more flexible and provide good support.
@Andy: did you try messing with image options in excel and setting the dpi parameters? I know this will work only with excel printing, but if the PDF conversion you are using works like a printer, then the PDF file should be of higher quality.
Also primoPDF has options to change the pdf quality.
@Chandoo: Yeah, I assumed you were talking free solutions, but I don’t consider Office 2007 free.
Not complaining, just clarifying. Love your work.
Andy –
Are the images bad on screen, or also in print? I had a project that printed various charts from PowerPoint and Excel to PDF using one of the many free PDF printer drivers. They all embed a bitmap based on the screen resolution for viewing on screen, which does not support PS. But when printed on PS printer, the low-res bitmap is ignored and the detailed underlying graphic is output.
Do you know any freeware which converts PDF to Excel?
@Mel.. you can try using http://www.pdftoexcelonline.com/ I have used it to convert few PDFs. The results are not that encouraging though. May be they have improved the logic since then.
Another option, if the files are not sensitive, is to upload them to a public website, wait until google crawls the PDF and then use google’s conversion of PDF.
When I save Excel 2007 files as pdf, the graphics and pictures are all messed up. This started happening after a Windows update. I have tried pdf creator from Sourceforge and dopdf. Both are causing Windows to crash with a blue screen. I use Vista 64.
Can anyone suggest what to do?
Currently I have to save excel files as 2003, move them to an XP computer, save them as pdf and move them back to the Vista computer. Microsoft seems not to care about this bug.
@Annika.. this sounds like a strange bug. Are the graphics and pictures looking fine in the print preview ? I am not sure if the problem is with excel alone. May be you can try converting a word doc to pdf using these tools and see if you get the blue screen. If that is the case, you may want to uninstall these programs and try some other add-in.
The print preview looks fine. The problem is only with Excel files. I have tried the same independently on 2 other computers with Vista and Office 2007. Same problem. I am certain that this is a Windows update problem. I have done this same type of work for over a year on the same computer with the same programs and this started happening a few weeks ago after a Windows update.
I tried 3 different pdf converters and uninstalled them after Windows kept crashing.
@Annika.. not sure if this helps, but there is a hotfix form MS about the layout problem. It might work for you.. http://support.microsoft.com/kb/973402/en-us
Thanks Chandoo, this hotfix sounds like it should work, but it failed to install. Looks like it’s made for 32 bit systems and I got 64 bit.
I hope there will be an other hotfix soon… I still have to save the files as old Excel, transfer to a XP computer and convert to pdf and move the files back again. Frustrating.
@Annika.
I’ve had similar issues.
I have ’07 SP1 on one box and SP2 on another.
SP1 works fine (I’m guessing the Add-In works differently from SP2)
SP2 is definitely the problem.
SP2 just produces useless output when saving as PDF with the built in functions.
One of our IT guys has dug around the net a bit for a solution (beyond the hotfix). There’s a lot of chatter about MS ‘Image rendering’ being the problem (a bit beyond my understanding)
Some suspicion is that an earlier update introduced the problem and a later fix is being developed to correct the rendering without negating all the original hotfixes fixes.
@Justin,
SP1 and SP2 both worked fine until an automatic update recently.
I have found that if I use scaling when creating the XL document and if it is not set at 100%, I will have this error when saving as PDF. Any graph, drawing or picture will be saved as 100% on the PDF and the rest is at the scale I had before, for example 84%.
This makes the entire document unreadable.
It was not a problem until about a month ago. I can not pinpoint the update that caused the problem. Maybe someone else can figure it out.
don’t use any soft
to fix the problem jast change the Unlicensed font in doc With
Default font
The KB973402 hotfix worked! It is truely amazing how much people I found with the same problem, searching the internet for a solution. It’s been around since the release of SP2, quite some months now, and no sign of a solution anywhere. Until I found this one. Top stuff!
I tried the KB973402 a second time and it actually installed this time. It fixed the pdf problem finally. Thank you Alex!
can u tell me when converting xls file to pdf using dompdf library in php, image is not displaying in pdf.All data are there in pdf.But image not.Let me know if u know of forward it
I used microsoft 2007 save as pdf, but it doesn’t zoom to the size I want. It doesn’t take the page set up at all. Any one knows how to work with this issue? Thanks a lot.
@Julie… I have faced similar problems too. I think excel “save as PDF” is mucking up design if the spreadsheet is too complicated (too many shapes, live pictures, charts, vba controls) I havent found a solution to this yet.
Julie –
If you designed the spreadsheet so it looked the way you want at 100%, does it work then? Excel sometimes has issues at zooms other than 100%.
At last! This problem has been bugging me for months on my work PC
Now I just need to get IT to install it!
Thanks
7-PDF Maker is a free conversion tool and, unlike the various PDF printers mentioned above, it preserves hyperlinks. So far the OpenOffice route has done all I need re hyperlinks to date and I haven’t yet tried 7-PDF Maker myself but it is well-regarded; see for example the review and discussion here:
http://www.techsupportalert.com/content/free-pdf-converter.htm
Many thx for this KB973402 hotfix Alex !!
I have finally figured out the absolutely best way to go. I converted my computer systems to Linux. Everything works wonderfully! There is no boot up time, there are no frustrating update processes requiring restarts, there are no windows crashes and no wasted time reading through hundreds of Microsoft pages for trouble shooting solutions.
If you want to get rid of the bloat ware and head aches forever, switch to Linux. There is no reason not to. You can install over 2000 free software to use, ranging from graphic design to computer programming. You don’t get viruses. You don’t have to pay all these licensing fees. And number one, you don’t have to deal with Microsoft ever again!
By the way, all your windows based documents and work files you have, will open in Linux applications. You can also install and run Linux on you windows computer as a separate partition. You will be able to access all the windows files from Linux.
I continued working with the Excel files I had problems with in windows and they opened fine in Open Office spreadsheet. Converting to pdf is a piece of cake, you just click “export as pdf” and it’s done.
The only thing I regret is that I didn’t do it years ago. There is no going back to windows.
Y’all have a great day!
@Annika… Linux, really ?!? Just so that you can make PDFs?
All the best.
PS: Does my blog render well on linux x-windows?
@Chandoo, well, I didn’t convert to Linux only for making pdfs. I did it because I was so sick and tired of Microsoft running my computer instead of myself. WinXP is ok, but Vista is the worst I have ever experienced in computers. When you work on deadlines, you have to run 3 computers simultaneously because one is always bogged down by windows updates.
So, yes, I am very happy with the decision and I will never go back to Windows.
Your blogg renders well on Linux, but I won’t need anymore advise on Windows…
Check out Ubuntulinux.org and try it!
I found an interesting bug in converting Excel 2007 SP2 files to pdf. On some files with images when there is an Adobe Acrobat pdf instance open (any pdf file will do) the pdf conversion has some artifacts. Closing down all open pdf instances and converting xlsx file to pdf again fixes the problem.
Hope that helps some one.
PS. Yes I did apply the http://support.microsoft.com/kb/973402/en-us fix
Dear All,
I have been using Pdf-Redirect for this purpose. You can use it for Excel as well as MS Word. Following is the link & it is also free to use.
http://download.cnet.com/PDF-ReDirect/3000-10743_4-10255233.html?part=dl-6248282&subj=dl&tag=button
I have adobe acrobat writer installed on my pc. Is there some way to automate “printing” to a pdf. The automation would allow me to pull the name of the file from the spreadsheet.
Thanks
Kevin
Up in comment #8, Ken Puls mentioned the fact that the free PDF Creator has a VBA interface, and he has a handful of articles about programmatically printing PDF documents from Excel:
http://www.excelguru.ca/node/21
Jon,
The first paragragh states “These code examples are built for PDFCreator, an open source PDF writer utility. Unlike Adobe Acrobat and CutePDF, which both require pro versions to create PDF’s via code, PDFCreator is completely free! Download PDF Creator from Sourceforge here. Please note that this code will NOT work with Adobe Acrobat.”
I have Adobe acrobat writer. Is there code out there for people with Adobe?
Okay, I’ll be more explicit. Remove Adobe Acrobat from your machine. Your machine will run better. Or at least uninstall the part that interferes with MS Office. Then download PDFCreator and use that.
My company released software to address one specific scenario (creating and distributing commissions statements from either MS Excel or Google Spreadsheets–i.e. many payees on one spreadsheet that typically requires a lot of copying, pasting and emailing). This hosted service takes the manual work out of this and then formats the statements as PDF’s that can be mailed or downloaded.. Check this out at the following URL: http://www.oneclickcommissions.com/wj.html
thanks for the tip. been looking for a pdf file converter that’s pretty decent and primo does the job well.
i didn’t know that you have to have sp2 for office2007 to convert files to pdf though so maybe i’ll be doing that as well.
Toto –
Generally you should stay current with updates. This is especially true with Office 2007, which had so many new and changed features, that more adjustments have been required.
Microsoft products and pdf have a real strange interaction.
For example, if you are in Powerpoint and have deck that navigates using hyperlinks to other slides within the deck and save as a pdf, the navigation will work in the pdf. ( I am using the Microsoft Office Professional 2010 and latest Adobe Acrobat Professional). However, if you have an Excel file with hyperlink navigation within the file and save as pdf then it will not work in the pdf file.
Even if you print to a pdf file the navigation does not work.
Mystery.
More
the reason in Powerpoint it works is that slide is equivalent to a page in pdf speak.
the conversion of excel has no cell reference in pdf.
@ Dear All,
there is a small VBA which i have learnt and tweaked to save n number of excel worksheet of single active workbook. make sure no sheet would be hidden otherwise it will throw an error.
What this code do ?
this will save your current active workbook’s all worksheet with date and time stamp to the same directory where your workbook is saved . Naming convention is like
Name of workbook -Name of Worksheet-Date and time
Sub tp()
Dim s As Integer
For s = 1 To Worksheets.Count
Worksheets(s).ExportAsFixedFormat xlTypePDF, ThisWorkbook.Path & “\” & ThisWorkbook.Name & “-” & Worksheets(s).Name & “-” & Format(Now, “ddmmyyyy-hhmmss”) & “.pdf”
Next s
End Sub
There are few more things like Saving all sheet in a single pdf.
Sub tp()
ThisWorkbook.ExportAsFixedFormat xlTypePDF, ThisWorkbook.Path & “\” & ThisWorkbook.Name & “-” & ActiveSheet.Name & “-” & Format(Now, “ddmmyyyy-hhmmss”) & “.pdf”
End sub
and for saving only active sheet the code is
Sub tp()
ActiveSheet.ExportAsFixedFormat xlTypePDF, ThisWorkbook.Path & “\” & ThisWorkbook.Name & “-” & ActiveSheet.Name & “-” & Format(Now, “ddmmyyyy-hhmmss”) & “.pdf”
End Sub
it seems quite a long post but cann’t resist to mention there is one alternative to the same is to use Acrobat 7.0 (writer) which install a printer in the name of “Adobe PDF” or “PDF” and when choosen this printer at the time of print for any thing WEB,DOCX,XLSX or any other document it will ask a location to save. and a copy will saved over there.
can i know how to put tags in post for codes to be appear in proper syntax.
can any one help on the same
@Brij
You can put a *Strong> around text */Strong> to make it Bold
.
You can put a *code> around text */Code> to make it code
This is shown as code.
You can put a *ul> around text */ul> to make it Underlined
This is shown as underlined
.
You can put a *li> around text */li> to make it
.
You can put a *em> around text */em> to make it Italic
This is shown as italic
.
In all examples above, Replace the * with a < at the start
Begin

Thanx Hui for the detail description

End Sub
If you have a hyperlink in your excel file when you convert to PDF it will no longer work.
I prefer DoPDF over PrimoPDF. It allows you to embed your fonts, and thus helps you retain your special characters and fancy fonts.
I hope this helps.
best one pdf convertor. thanks
There are many free online document converters available these days that you can use to convert your excel document to other formats including PDF one such converter is this one Saaspose.Cells
I use Nitro PDF Creator,,
Man, you should try this one out also: http://www.kitpdf.com/. I use it all the time to convert from web to PDF. Also it’s cool when you want to put a PDF book on a kindle, you can convert it quickly online.
problem for convert xls to pdf with photo link:
I have one xls file that included photos.
While click in name photo(example 23)image opened.
But i convert xls file to pdf photo not open.
pls help me
I have had a good experience with http://www.pdfen.net. I just upload my Excel files, reorder them if needed and then download the newly made file!
@Dear all,
i need a big help about converting excel to protected pdf. i have adobe acrobat pro also primo pdf.is there a way to converting a worksheet into pdf using vba with primo pdf or adobe acrobat pro?
1- how to excel use vba code to convert image to pdf
2- how to excel use vba code to scan pdf
Hi there, You’ve done a fantastic job. I will definitely digg it and personally suggest to my
friends. I’m confident they will be benefited from
this site.