
It has been a while since I have proposed “tweetboards” an option for people making dashboards. I have received two very good examples of the dynamic (automatically updating) tweetboard implementations from our readers.
1. The first example from Fernando
I must appreciate Fernando for sending this beautifully implemented tweetboard. Not only that, he took great troubles to change the formulas so that the dashboard would work in my version of Excel (he prepared it in Portuguese version where the formulas are named differently, so when I open it in my comp, the formulas would show #NAME! error)
Thank you Fernando 🙂
Download the tweetboard implementation example 1 and see it yourself.
2. The second example from Lee
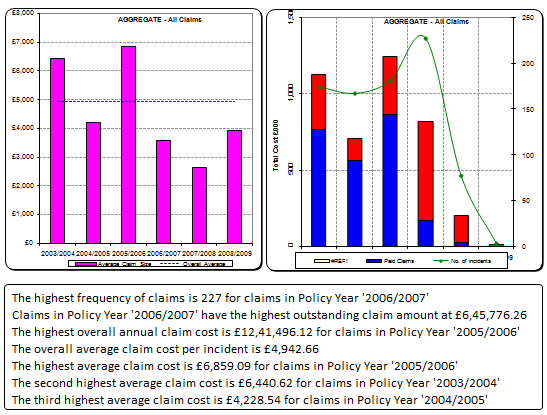
Lee has combined traditional dashboard charts with descriptive text message idea from tweetboard to create this neat claims dashboard. It is very well implemented.
Thank you Lee 🙂
Download the tweetboard implementation example 2 and see it for yourself.
If you want to share your tweetboard implementations
Please drop a comment or tweet me at @r1c1 or email me at chandooDOTd @ gmail.com
If you are wondering what the hell tweetboards are…
Read this post.
Also, read our 6 part tutorial on preparing KPI dashboards in Excel.


5 Responses
Could you consider posting the downloads as .xls files as well as .zip files.
XLS files usually get through the firewall but zip files don’t.
I didn’t say the policy made sense. 🙂
@Sean: you can find the xls version for Fernando’s implementation here: http://cid-b663e096d6c08c74.skydrive.live.com/self.aspx/Public/tweetboard-v2-en-fernando.xls
Hi
Can you tell me where the drop down list of dates is controlled from? I was trying to expand the list of dates, but couldnt figure how to do it.
Thanks
Andrew
sorry I am a dufus, It is controlled by data validation.