After reading the Japanese Candlestick Charts in Excel post, Gene asks me in an email,
I’m trying to graph candlestick charts in Excel for 10 minute candles. Excel seems to allow daily only with its stock templates. Can you point me to any resources for creating intraday candle charts?
Of course, being the smart person Gene is, he figured out that even before I could send an email back (he used box plots to mimic 10 minute candles)
But there should be a way to make intraday candlestick charts using the regular stock chart in excel. Isn’t it?
Well, there is a way.
As an aside, you might wonder what an intraday candlestick is?
Well, I am no day trading expert nor a technical analyst of stock markets, but statistically speaking, there can be high, low, open and close values for any given interval. Although, on a busy day, you might find that close of a 10 minute interval is equal to open of the next 10 minute interval. But, these days, the stock markets are seldom busy (unless you are busy selling 😉 ). Again, I digress. So going back to the intraday candlestick charts,
1. First get the intraday stock price movement data
2. Now, Create a regular candlestick stock chart
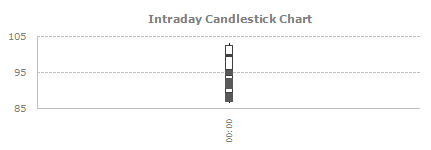
When you are done, the chart should look something like this:

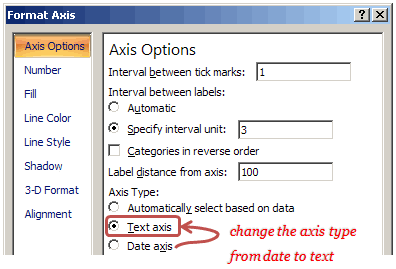
3. Select date axis (horizontal axis) and press ctrl+1 (or right click and go to format axis)
And change the axis type from “date” to “text”
Also, set the interval between labels to 3 or something like that. This will reduce the label clutter.

That is all. You will now have an intraday candlestick chart that looks like this:

Download the intraday candlestick chart template and play with it.


4 Responses to “Intraday Candlestick Charting [Stock Charts]”
I have searched in google. But I am not able to find the the data where time is coming. In your template you have used your hand written data or taken from the site ?
If taken from the site then can you please give me the link so that I can also test the same.
Thank YOu
I download data from the S&P 500 at the end of the day. I need a simple "daily template" to display these values > Date-Open-High-Low-Close. Preferably a 1 to 6 month chart.
1) I need a common daily Candlestick Chart listing the day and prices as axis X and Y.
2) I need three (Exponential Moving Average Lines) > EMA 13 - EMA 21 -EMA 34 on the chart.
3) I need to be able to (manually) change the daily candlestick colors to Red or Green. The unchanged colors can remain Black.
4) I need to add text to the chart.
Can someone create a chart like this for me? And how much would it cost? I don't have time to learn how to do it.
Please respond by email.
Thank You,
Mike
I AM TRYING TO PUT MOVING AVERAGES ON A CANDLESTICK CHART
USING EXCEL. I AM HAVING PROBLEMS DOING THIS. CAN YOU HELP?
I am trying to insert stock quotes into an Excel spreadsheet. I want the formula to get the quote for the individual stock or mutual fund. I have been using the following; =MSNstockquote($R8) where R8 contains the stock ticker symbol. This has been working for a long time and suddenly it keeps indicating #Value in the quote cel/