
Everyweek PHD celebrates the art of visualization by showcasing some of the best infographic visualizations. These are both inspirational and fun.

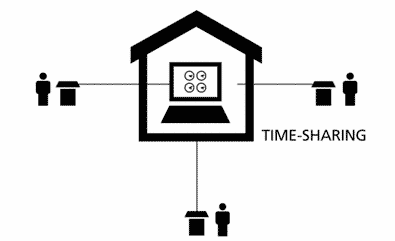
User journeys are a very good way to depict how user interacts with a system and help designers and developers understand the system better. Wireframe blog features this unique 3d user journey map that is both eye candy and very useful.
How Game Controllers changed over time
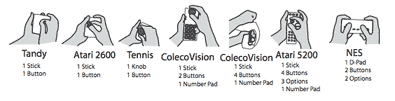
Damien Lopez has designed these wonderful illustrations of game controllers have evolved since their birth. Pretty informative and fun to watch. Also check out comparison between Wiimote, Xbox and Play station controllers
Map of Internet Cables, How big internet is

The internet is an undersea world, but do you have any idea how massive it is ? Well, this picture shows it all, and shows it really well.
Ok, this has been doing rounds for a while now, the History of Internet video by vimeo is a pretty cool visualization explaining the history of internet and www to us. Do check it out this weekend 🙂 (embedded below, if you don’t see it, just click the link above)
History of the Internet from PICOL on Vimeo.
If Milkyway is a giant metro system, this is how the transit map would look like
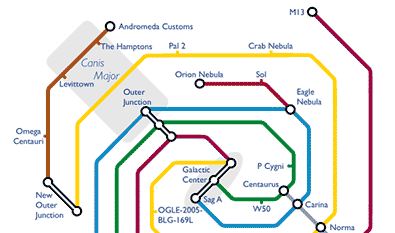
What is a weekend without some visualization fun. The milkyway transit map shows the milkyway galaxy and posistion of various systems in that and connects them with the familiar metro transit map layout.
Got a link or visualization to share?
Drop a comment or email me at chandoo.d at gmail.com. Happy weekend 🙂


.jpg)
3 Responses
I must really be an old curmudgeon. I have little patience for so much of what passes for good infographics these days.
The first one (like many others) reminds me of Sim City or Roller Coaster Tycoon, so much I have no patience to look closer.
The game controllers was okay, a small multiples illustration of controller interface evolution.
The internet cable map is nice, but I like almost any geographical map. The original infographic format.
I skipped the History of the Internet video. The only videos I have any patience for at all are music videos.
The Milky Way metro transit map was good, but I like maps (did I say that yet?). I also like infographics with a sense of humor, like the Pacman pie chart.
I actually think the history of the net video is worth watching. I normally have a short tolerance for this type of thing, but really enjoyed it.
@Jon: While the first one may remind you of simcity I actually liked it very much due to its applicability in my day to day work. I am a business analyst and my job demands effective visualization and documentation of user requirements for an IT solution. The user journeys seemed like a fresh and useful idea worth sharing.
I suggest you to watch the internet video, it is small (8 mins) and neatly done. It kind of shows how visualizations in future can be.
@Lincoln: Me too 🙂