
This article is part of our VBA Crash Course. Please read the rest of the articles in this series by clicking below links.

- What is VBA & Writing your First VBA Macro in Excel
- Understanding Variables, Conditions & Loops in VBA
- Using Cells, Ranges & Other Objects in your Macros
- Putting it all together – Your First VBA Application using Excel
- My Top 10 Tips for Mastering VBA & Excel Macros
Introduction to Excel VBA
Everyone has a language. My mother tongue is Telugu. But I also speak Hindi, English and Cutish (that is the language my 2 year old kids speak). You may be fluent in English, Spanish, French, German or Vietnamese.
Just like you and I, Excel has a language too, the one it can speak and understand. This language is called as VBA (Visual Basic for Applications).
When you tell instructions to Excel in this VBA language, Excel can do what you tell it. Thus enabling you to program Excel so that you can automate a boring report, format a big&ugly chart, clean-up some messy data or just play some random noises.
What is a Macro then?
A macro is nothing but a set of instructions you give Excel in the VBA language.
Writing Your First Macro
Note: If you are new computer programming, watch our Introduction to Programming Video before proceeding.
In order to write your first VBA program (or Macro), you need to know the language first. This is where Excel’s tape recorder will help us.
Tape Recorder?!?
Yes. Excel has a built-in tape recorder, that listens and records everything you do, in Excel’s own language, ie VBA.
Since we dont know any VBA, we will use this recorder to record our actions and then we will see recorded instructions (called as code in computer lingo) to understand how VBA looks like.
Our First VBA Macro – MakeMeRed()
Now that you understand some VBA jargon, lets move on and write our very first VBA Macro. The objective is simple. When we run this macro, it is going to color the currently selected cell with Red. Why red? Oh, red is pretty, bright and awesome – just like you.
This is how our macro is going to work when it is done.

6 steps to writing your first macro
If you do not see Developer ribbon, follow these instructions.
Excel 2007:
1. Click on Office button (top left)
2. Go to Excel Options
3. Go to Popular
4. Check “Show Developer Tab in Ribbon” (3rd Check box)
5. Click ok.
Excel 2010:
1. Click on File Menu (top left)
2. Go to Options
3. Select “Customize Ribbon”
4. Make sure “Developer tab” is checked in right side area
5. Click ok.
Step 1: Select any cell & start macro recorder
This is the easiest part. Just select any cell and go to Developer Ribbon & click on Record Macro button.

Step 2: Give a name to your Macro
Specify a name for your macro. I called mine MakeMeRed. You can choose whatever you want. Just make sure there are no spaces or special characters in the name (except underscore)
Click OK when done.
Step 3: Fill the current cell with red color
This is easy as eating pie. Just go to Home ribbon and fill red color in the current cell.
Step 4: Stop Recording
Now that you have done the only step in our macro, its time to stop Excel’s tape recorder. Go to Developer ribbon and hit “stop recording” button.

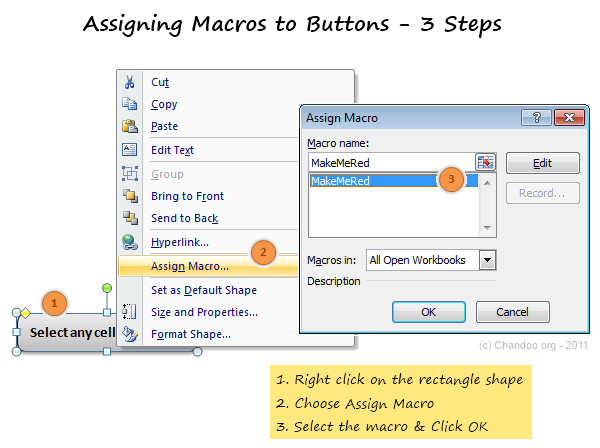
Step 5: Assign your Macro to a button
Now go to Insert ribbon and draw a nice rectangle. Then, put some text like “click me to fill red” in it.
Then right click on the rectangle shape and go to Assign Macro. And select the MakeMeRed macro from the list shown. Click ok.
Step 6: Go ahead and play with your first macro
That is all. Now, we have linked the rectangle shape to your macro. Whenever you click it, Excel would drop a bucket of red paint in the selected cell(s).
Go ahead and play with this little macro of ours.
Understanding the MakeMeRed Macro Code
Now that your first macro is working, lets peek behind the scenes and understand what VBA instructions are required to fill a cell with red.
To do this, right click on your current sheet name (bottom left) and click on View code option. (You can also press ALT+F11 to do the same).
This opens Visual Basic Editor – a place where you can view & edit various VBA instructions (macros, code) to get things done in Excel.
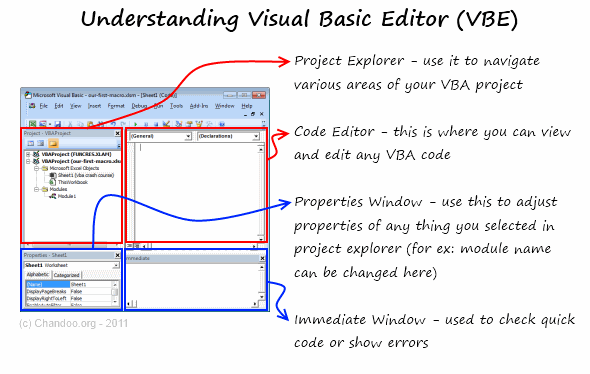
Understanding the Visual Basic Editor:
Before understanding the MakeMeRed macro, we need to be familiar with VBE (Visual Basic Editor). See this drawing to understand it.
Viewing the VBA behind MakeMeRed
- Select Module 1 from left side area of VBE (called as Project Explorer).
- Double click on it to open it in Editor Area (top right, big white rectangle)
- You can see the VBA Code behind MakeMeRed
If you have followed the instructions above, your code should look like this:
Sub MakeMeRed()

'

' MakeMeRed Macro

'

With Selection.Interior

.Pattern = xlSolid

.PatternColorIndex = xlAutomatic

.Color = 192

.TintAndShade = 0

.PatternTintAndShade = 0

End With

End Sub
So much for a simple red paint!!!
Well, what can I say, Excel is rather verbose when it is recording.
Understanding the MakeMeRed VBA Code
Lets go thru the entire Macro code one line at a time.
- Sub MakeMeRed(): This line tells Excel that we are writing a new set of instructions. The word SUB indicates that the following lines of VBA are a sub-procedure (or sub-routine). Which in computer lingo means, a group of related instructions meant to be followed together to do something meaningful. The Sub-procedure ends when Excel sees the phrase “End Sub”
- Lines starting with a single quote (‘): These lines are comments. Excel will ignore anything you write after a single quote. These are meant for your understanding.
- With Selection.Interior: While filling a cell with Red color may seem like one step for you and I, it is in fact a lot of steps for your computer. And whenever you need to do a lot of operations on the same thing (in this case, selected cell), it is better to bunch all of them. This is where the WITH statement comes in to picture. When Excel sees With Seletion.Interior, Excel is going to think, “ok, I am going to do all the next operations on Selected Cell’s Interior until I see End With line“
- Lines starting with .: These are the lines that tell Excel to format the cell’s interior. In this case, the most important line is .Color = 192 which is telling Excel to fill Red color in the selected cell.
- End With: This marks the end of With block.
- End Sub: This marks the end of our little macro named MakeMeRed().
Few Tips to understand this macro better:
Once you are examining the macro code, here are a few ways to learn better.
- Change something: You can change almost any line of the macro to see what happens. For example, change .color = 192 to .color = 62 and save. Then come back to Excel and run your macro to see what happens.
- Delete something: You can remove some of the lines in the macro to see what happens. Remove the line .PatternColorIndex = xlAutomatic and run again to see what happens.
Download Example Workbook to learn VBA
Click here to download the example workbook with MakeMeRed Macro.
Excel 2003 Compatible Version here.
Play with the code & understand this better.
What Next – Understanding Variables, Conditions & Loops
In the part 2 of this tutorial, Learn about variables, conditions & loops – basic programming structures of VBA.
Do you write VBA Code? Share your experience?
Thanks to my college education & job experience. I am trained to be a programmer. So I find VBA quite intuitive and easy to use. But that may not be the case for many of you who latch on to VBA without any formal education.
I would like to know how you learn VBA and what experiences you had when you wrote that first macro. Please share using comments.
Join Our VBA Classes
We run an online VBA (Macros) Class to make you awesome. This class offers 20+ hours of video content on all aspects of VBA – right from basics to advanced stuff. You can watch the lessons anytime and learn at your own pace. Each lesson offers a download workbook with sample code. If you are interested to learn VBA and become a master in it, please consider joining this course.


26 Responses to “FIFA Worldcup Excel Spreadsheets [Roundup]”
Nice roundup! Do you know of any one-page spreadsheets which will be updated by an administrator after each game? Would be nice to be able to print out the latest results whenever I feel like checking them as I probably won't be following closely every day.
I actually haven't tried any of the above ones yet, but I thought I'd mention this one that I found which makes a nice one-page form you can fill in dynamically. http://exceltemplate.net/sports/world-cup-2010-schedule-and-scoresheet/
I would like to recommend you these one: http://www.anotagol.com/
You can choose your interface language (english, spanish, italian, portuguese, german or french) and your country for the timezone of match. I like it very much.
An awesome online world cup calendar in flash.
http://www.marca.com/deporte/futbol/mundial/sudafrica-2010/calendario-english.html
Got one more tracker in excel (one page)
http://cid-b09e57e6e960505c.office.live.com/browse.aspx/.Public
[...] Passend zu gerade laufenden Fußball-WM gibt es auf Chandoo.org alles wissenswerte über Excel-Anwendungen für den Fußball-Fan. [...]
Great!!!
I strongly recommend this :
http://www.en.excel-soccer-2010.de/downloads
Chandoo how you found this ...
@Rohit.. really beautiful file. I missed it during my research. Now, I recommend it. 🙂
Hi Chandoo - thanks for the recommandation 🙂 - Regards
[...] Excel, then print it on the other side of your Match Schedule from step 2 above. There are several other Excel spreadsheet templates you can download, but this is probably the only one-page version you can find; plus, it [...]
Does anybody know how to re-create this(?): http://www.marca.com/deporte/futbol/mundial/sudafrica-2010/calendario-english.html
...or do you know where a template can be found? I am DYING to have something like this on my site. When I found it, I had been looking for the longest time for a circular calendar. I found a couple that weren't adequate. Then I stumbled upon this one and my eyes nearly popped out of my head. If anyone can lead me in the right direction, I would be eternally grateful!
Thanks in advance!
Robert
@Robert...
Doing something like that is a lot of work. You can probably get it done with some hired help from a flash developer.
@Robert, the World Cup flash in the Spanish Marca newspaper is impresive, but not much as my own animated spreadsheet with the Goals of 2010 World Cup South Africa in Excel that I just published into my blog:
http://pedrowave.blogspot.com/2010/06/goals-of-2010-world-cup-south-africa-in.html
Download from here:
http://cid-6b219f16da7128e3.office.live.com/view.aspx/.Public/Goals%20South%20Africa%20Animated.xlsx
And start to enter the goals of the rest of matches.
Has anyone seen, or made, a Spreadsheet where you can record the scorers and see a 'top scorers' chart. Would be a nice enhancement
@Neil... checkout this one http://www.inflexionary.com/sports/world-cup-2010-excel
it uses macros to fetch scores from web (and provides very comprehensive analysis too)
@All.. Thanks for the comments. I have updated the post with few more links now.
Hi,
Check this dashboards too:
http://dashboards.org/world-cup-dashboards-and-visualizations/
😉
[...] Here is a collection of FIFA World Cup Spreadsheets if you are more in to that sort of thing. | [...]
[...] Cup fever is here!In FIFA Worldcup Excel Spreadsheets Roundup, Chandoo has some links to useful World Cup tracking workbooks. Only one of them (the first one) [...]
[...] World Cup fever is here!In FIFA Worldcup Excel Spreadsheets Roundup, Chandoo has some links to useful World Cup tracking workbooks. Only one of them (the first one) [...]
Hey, you missed ours! It has everything you need and more, but not a whole pile of silly extras (National Anthems, etc). I'll be making another one for the 2014 world cup. We had over 4000 hits on it!
@Michael Harwood.
Where is it then? You should have posted a link
Sie sollten an einem Wettbewerb teil zu nehmen für einen der besten Blogs im Web. Ich werde empfehlen Sie diese Seite!
Google translation: You should take part in a contest for one of the best blogs on the web. I will recommend this site!
[...] and welcome to the forum, Maybe these similar spreadsheets might give you a few initial ideas: FIFA Worldcup Excel Spreadsheets [Roundup] | Chandoo.org - Learn Microsoft Excel Online If you have specific areas / formulae / layout choices for parts of your spreadsheet that you are [...]
Calling all football fans around the globe! The biggest football festival will kick off on the 12th June 2014 and everyone is placing their bets of who will have the honour of lifting the golden trophy.
Use our free interactive Excel templatel to predict the World cup finalists ! No macros !
http://www.spreadsheet1.com/world-cup-2014-free-excel-prediction-template.html
I also made a Worldcup-tracker, with MS Access, which can also generate reports in Excel
e.g. a match-schedule with locations on y-axis and dates on x-axis, see:
http://worktimesheet2014.blogspot.com.es/2014/05/excel-with-match-schedule-for-2014-fifa.html
and:
http://worktimesheet2014.blogspot.com.es/2014/05/match-access-app-to-track-world-cup.html
where can i find raw data in excel file format of fifa world cups (1930-2014)
@Vivek
Have a read of: http://chandoo.org/forum/threads/goal-of-world-cup.17637/
The location is mentioned in Somendra's comments
Free XLSX Prediction Spreadsheet for World Cup 2018 Russia!
https://www.spreadsheet1.com/fifa-world-cup-2018-russia-free-prediction-templates-for-excel.html