
We have written about dynamic charts several times before. But I think the technique I am going to show you today beats them all. It is so simple, so easy to set up and so beautiful that I am cursing myself for nothing thinking of it earlier.
First take a look at the dynamic charts in excel demo:
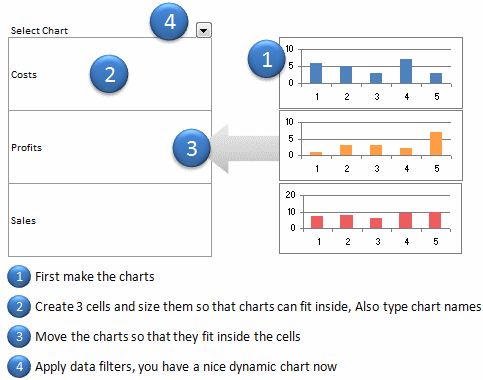
Just follow these 5 steps to create the dynamic chart in excel:
1. Prepare your charts: Make as many charts as you want. Lets say 3.
2. Set up the area where dynamic charts will be loaded: Just take 3 cells in a row and adjust the row height and column width such that the charts can be fit inside snugly. Also, type the chart names (1 for each cell) in the cell. Let us say, the charts you have are for Costs, Sales and Profits, just type these names in the cells.
3. Move and fit charts inside these cells: This should be simple.
4. Finally apply data filter to the cell on top of the 3 cells. Select a filter option and you will see only that chart.
5. Show off your dynamic chart and let people know you kick excel’s butt.
You can see these steps in the dynamic chart tutorial below:
What do you think about this technique?
Which technique you like better? This one or the Dynamic Charts using INDEX() function, Use Data Filters as Chart Filters tips? One issue I can think of with this technique is that, there is no way the filter will tell which chart is selected (as the chart covers the cell text). But this can be overcome with chart titles.
This post is part of our Spreadcheats series, a 30 day online excel training program for office goers and spreadsheet users. Join today.


25 Responses to “Shift Calendar Template – FREE Download”
Hi Chandoo,
your recent postings include only Excel 2007 templates. Unfortunately the company I work at still runs Excel 2003. Is it possible to get your awesome files in other excel version as well?
Thanks so much for your great excel stuff!
Is it possible to do this for shifts with hours instead of days? To organise a three shift day?
Thanks in advance,
Stelios
In my organization there are 45 employees i need split then into three shifts ex:A shift:14,B shift:14,C shift:14 and week off:3 kindly help me on this.
@Masthan
You need to understand what rules your company has for the various shifts / roster combinations
Chandoo, I once did a shift control spreadsheet for my team. I put one person in each line, the columns were the days. I put a shift code in each cell indicating in which shift that person should work, or if the person were out that day. I have two codes for being out. One is for vacations and one is to compensate days worked in weekends. This way I was able to count how many persons I have in each shift, how many were on vacations and how many were out compensating (that's the term we use here) weekend worked hours.
Later I included the possibility of a person be in two lines one for normal hours other for overtime. This is mainly used for planning purposes. If you would like I can send you an example. The only problem of this spreadsheet is that we don't have a person view, only this consolidated view.
Hi George, I would like to have a copy of your spreadsheet if you can share it.
Thanks in advance, Chuck
Hi Chandoo,
Where is the code located ? is it VBA ? If so , how do you hide it ? Or it is .NET ?
Thx
@Idan
.
No VBA or code, it is all done with Mirrors.
Only Joking,
.
But there is no VBA or code,
It is all done with Named Formulas and Lookups.
Have alook at the cells in the calander area and Named Formulas in the Formulas, Name Manager Tab.
How can i calculate between two or more different workbooks? Please, reply me as early as possible.
@Anand
Open the workbooks you want to link to
Start a formula = and click and change between workbooks as required.
You can use the View, Switch window menu to change workbooks mid formula
The format for using workbooks is
=[Workbook.xlsm]Sheet1!$A$1
or
=SUM('[Book2.xls]Sheet1'!$A$1:$D$10)
etc
Hi Chandoo,
I am working with a call centre wherein i ned to update at the month end 20 to 30 employees login hours which are defict to track it at the month end is very difficult is there any template which can be made to track that why on a particular day a guy who needs to be on calls was why not on calls.
Thank you so much Chandoo. This is really helping me. As usual, you rock.
What's FortyTwoDays and Calendar in Name manager?
Both are unused and FortyTwoDays doesn't make any sense.
I have a SQL db that contains records of events scheduled/completed on a particular date. Can this method ous building a calendar be used to display those events on the respective day?
Positively awesome!
I'm attempting to help a friend create a schedule for adult classes - and of course its not"paid help". Here is the scenario:
20 classes, instructor, room#, student class size, start date, number of class days (need to subtract weekends)
class
instructor
room
students
start
#days
PATH
karen
201
21
01/01/13
11
BILLING
jane
401
15
01/12/13
13
MEDISOFT
mike
301
11
01/25/13
9
he'd like to see these classes show up in different colors within the same month's calendar chart. He can draw it, but I'd like to see it done automatically through data, and I just can't visualize it, but I KNOW this will work - can you help?
Jan 🙂
Dear chandoo,
Try many way to download still can't access. Any way we want to try out 3 shifts with 3 guys in a group .eg Group A Morn, Group B Night and Group C Rest. And every each group must work on sunday to take turns. In fact we are security teams so that's why sunday is required to work. Pls guide and show how to put in the working calendar. Thank you in advance.
I've been trying to copy and/or recreate this to use in a workbook I'm doing for the transportation department I'm working for. I need to have the calendar on the first sheet in my document (it has graph's from data on another sheet). I'm trying to use it to track (with the conditional formatting) accidents and injuries. I've redone the conditional formatting to do 4 different accident types (no injury, near miss, OSHA recordable injury and work loss injury), but when I enter the formula's you have in the calendar portion where it says "DateOfFirst-FirstWeekDay" I can't figure out how you did that. Are you able to help?
I would like to use Excel to solve the following problem for a community work. I want to create a Driver schedule for a given month from a pool of volunteers for a community service. Each of these volunteers can drive only on specific days in a week. I would like to populate the driving schedule for each weekday with primary, secondary and tertiary drivers in a random fashion so that I do not overburden one person. I would greatly any help you can provide.
Hi chandoo,
Thanks for your valuable effort for create this template and let me know how to add multiple employees in the the Roaster.
Hi Chandoo,
This article on shift roaster is very helpful. Could you please let me know how i can use the same for n number of resources who work 24/7, considering their leaves and holidays?
Thanks,
Savitha
Hi Chandoo,
This article on shift roaster is very helpful to all. Could you please let me know how i can use the same if I want to add for some more shifts, since the color is not getting change if I add more shifts like 4,5 etc.,
Thanks,
Murali
nice post
How can I change the date to 2017 under Shift Data worksheet.
solution 1:
mydata=B2:C16
stoplist=E2:E8
=LET(RNG,A2:A16,SMR,C2:C16, F,(RNG=E2)+(RNG=E3)+(RNG=E4)+(RNG=E5)+(RNG=E6)+(RNG=E7)+(RNG=E8),SUM(SMR)-SUM(SMR*F))
=LET(RNG,A2:A16,SMR,C2:C16,RH,N(B2:B16=B2), F,(RNG=E2)+(RNG=E3)+(RNG=E4)+(RNG=E5)+(RNG=E6)+(RNG=E7)+(RNG=E8),TOT,SUM(SMR)-SUM(SMR*RH*F),SUM(SMR*RH)-SUM(SMR* RH*F))
ALTERNATE SOLUTION
=SUM(C2:C16)-SUM(FILTER(C2:C16,ISNUMBER(BYROW(A2:A16,LAMBDA(a,TOROW(SEARCH(a,E2:E8),2))))))
=SUM((B2:B16=B2)*(C2:C16))-SUM((ISNUMBER(BYROW(A2:A16,LAMBDA(a,TOROW(SEARCH(a,E2:E8),2))))*(B2:B16=B2)*(C2:C16)))
let
Source = Excel.CurrentWorkbook(){[Name="Table1"]}[Content],
#"Replaced Value" = Table.ReplaceValue(Source,null,";",Replacer.ReplaceValue,{"Column1"}),
#"Transposed Table" = Table.Transpose(#"Replaced Value"),
#"Removed Other Columns" = Table.SelectColumns(#"Transposed Table",{"Column1", "Column2", "Column3", "Column4", "Column5", "Column6", "Column7", "Column8", "Column9", "Column10", "Column11", "Column12", "Column13", "Column14", "Column15", "Column16", "Column17", "Column18", "Column19", "Column20", "Column21", "Column22", "Column23", "Column24", "Column25", "Column26", "Column27", "Column28", "Column29", "Column30", "Column31", "Column32", "Column33", "Column34", "Column35", "Column36", "Column37", "Column38", "Column39", "Column40", "Column41", "Column42", "Column43", "Column44", "Column45", "Column46", "Column47", "Column48", "Column49", "Column50", "Column51", "Column52", "Column53", "Column54", "Column55", "Column56", "Column57", "Column58", "Column59", "Column60", "Column61", "Column62", "Column63", "Column64", "Column65", "Column66", "Column67", "Column68", "Column69", "Column70", "Column71", "Column72", "Column73", "Column74", "Column75", "Column76", "Column77", "Column78", "Column79", "Column80", "Column81", "Column82", "Column83", "Column84", "Column85", "Column86", "Column87"}),
#"Merged Columns" = Table.CombineColumns(#"Removed Other Columns",{"Column1", "Column2", "Column3", "Column4", "Column5", "Column6", "Column7", "Column8", "Column9", "Column10", "Column11", "Column12", "Column13", "Column14", "Column15", "Column16", "Column17", "Column18", "Column19", "Column20", "Column21", "Column22", "Column23", "Column24", "Column25", "Column26", "Column27", "Column28", "Column29", "Column30", "Column31", "Column32", "Column33", "Column34", "Column35", "Column36", "Column37", "Column38", "Column39", "Column40", "Column41", "Column42", "Column43", "Column44", "Column45", "Column46", "Column47", "Column48", "Column49", "Column50", "Column51", "Column52", "Column53", "Column54", "Column55", "Column56", "Column57", "Column58", "Column59", "Column60", "Column61", "Column62", "Column63", "Column64", "Column65", "Column66", "Column67", "Column68", "Column69", "Column70", "Column71", "Column72", "Column73", "Column74", "Column75", "Column76", "Column77", "Column78", "Column79", "Column80", "Column81", "Column82", "Column83", "Column84", "Column85", "Column86", "Column87"},Combiner.CombineTextByDelimiter("|", QuoteStyle.None),"Merged"),
#"Split Column by Delimiter" = Table.ExpandListColumn(Table.TransformColumns(#"Merged Columns", {{"Merged", Splitter.SplitTextByDelimiter(";", QuoteStyle.Csv), let itemType = (type nullable text) meta [Serialized.Text = true] in type {itemType}}}), "Merged"),
#"Added Prefix" = Table.TransformColumns(#"Split Column by Delimiter", {{"Merged", each "|" & _, type text}}),
#"Replaced Value1" = Table.ReplaceValue(#"Added Prefix","||","|",Replacer.ReplaceText,{"Merged"}),
#"Split Column by Delimiter1" = Table.SplitColumn(#"Replaced Value1", "Merged", Splitter.SplitTextByDelimiter("|", QuoteStyle.Csv), {"Merged.1", "Merged.2", "Merged.3", "Merged.4", "Merged.5", "Merged.6", "Merged.7", "Merged.8"}),
#"Removed Columns" = Table.RemoveColumns(#"Split Column by Delimiter1",{"Merged.1"}),
#"Removed Duplicates" = Table.Distinct(#"Removed Columns")
in
#"Removed Duplicates"