
Update 1: you can make a chart or dashboard or combo chart.
Update 2: Download file changed, fixed an error with dates.
Update 3: We got a sponsor, it is Zoho. Scroll down to see more.
Here is a challenge many people face. How to make a chart visualizing sales data with several dimensions like product, brand, region, sales person name, year (or month or quarter) and one or two values like sales, # of units sold, profits, # of new customers.
In visualization challenge #2, all you have to do is a make one chart (dashboards are ok too) to visualize this sales data effectively.
The Data
Download the CSV file with data [mirror]. It has 28 columns – Region,Product,Customer Type,Sales Person Name and 24 Months starting Jan 08.
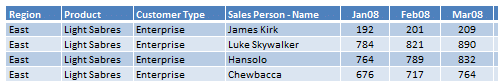
The Objective
You have to make one chart (or dashboards) using this data that would help a senior manager understand how the sales people have done in the 24 months. The chart can be dynamic / interactive / macro based. You can use any software (not just excel) to make this chart.
The Booty
The winner gets an … wait for it … iPod Touch 8GB sponsored by good folks at Zoho Reports. That is right. We are going all out to make sure you submit the best.

2 more contestants will get a complimentary copy of project management bundle for excel.
The Fineprint, read all of these before you start your engines:
- You can submit any number of entries.
- You are free to change the actual numbers in the data. I just used RANDBETWEEN () to get these values. You can replace them with some other numbers if you want.
- The contest is open from now to 28-Nov-2009.
- Winner will be selected using a poll by our readers.
- There is a second and third prize too. 2 contestants will get one copy of Project Management Templates Set.
- You can use any software, but you must submit the source files (or alteast stuff close to that) so that our readers can download and play with the files.
- International contestants – If Amazon or Apple don’t ship the iPod to your country, we are still cool. You can choose to have some other product that can be bought online and delivered to you, because we are awesome like that.
How to submit entries?
- Download the data and make the chart(s).
- Upload the chart source files, any images to a free online storage service like skydrive.
- Drop a comment here with links to your files.
- Alternatively e-mail the files to me (I am e-mail rustic. So expect few days delay before I upload them somewhere) at chandoo.d @ gmail.com
- Please note: You agree that the files you submit can be freely distributed to readers on PHD for learning purposes.
Contest Sponsored by Zoho Reports
![]() This contest is sponsored by awesome folks at Zoho Reports, Online Reporting and Business Intelligence Service
This contest is sponsored by awesome folks at Zoho Reports, Online Reporting and Business Intelligence Service
Please spread the message:
Take a minute and e-mail a friend or tweet about this contest or share this on facebook. The more people participating in this, the better it is for us. We can learn several interesting implementations.


63 Responses
My Master (put Anakin’s voice when he’s on his knees turning in to the dark side…):
As dumb as my question may seem, and at the risk to loose my hands cut by a laser sabre, here it goes:
can we change the data layout? I was thinking on adding a Date Column, instead of having it by month.
waiting command….
Any chance you can change the dataset to be less random? I know you say we can do it, but that way people can create a non-level playing field. As it stands, the existing data’s so random there’s nothing to “discover” by visualising it. All I’ve found so far is that everyone’s going up at some random but steady rate.
If you could hide some stories in the data, it’d be a better way to judge people’s visualisations – you can put them in there for us to discover, rather than let us fabricate them.
Great idea for a competition by the way!
@Martin.. yeah.. please do. END COMMAND
@Andy… Good idea. 2 points.
1) I have chosen random data because I wanted solutions to work on any data.
2) Plus I do not have any ready made data that is non random.
do you have any such data that we can use?
@all the ONE chart rule is gone. You can make a dashboard / chart to get in. Go!
(oh yeah, you can make combo charts as well)
At the beginning of the challenge you indicated a few other data points that doint exist in the .csv file, unit #s, unit gross profit, # of customers, or new customers. Those would be incredibly fascinating points to pull together for analysis, but if we’re left to make them up, you might find widely disparate results for which to compare. Do you have any thoughts about how to resolve? Or do we just make them up and provide an analysis based on our assumptions?
Hi!
Excellent site!
I just send an email with the file.
Sorry, due to the proxy, some sites of storage are not allowed.
Tks.
@Bryan… no that was meant to indicate the type of things that get charted. The challenge is to make charts for the included data only (which is just sales figures). I know it would be exciting to have other numbers as well, but may be we will save it for another day.
Chandoo, may I suggest to classify the uploads in 2 categories: those made only in Excel AS-IS, and those made with addons and/or other tools. Some of us are using the plain vanilla Excel 2003, with no chance to change that….
A dumb date question… is the date range encompassed in this data January 8, February 8, March 8, etc. through December 8, 2009, and then again January 9, February 9, March 9, etc. through December 9, 2009? Or is it August 1-12, 2009 and then September 1-12, 2009?
Either way, I’m not sure I follow why this periodicity.
@Martin:
Sure, why not. But I cant give 2 prizes 😀
@Ran:
Doh! I havent realized this. They are meant to be first date of each month. I think auto fill kind of messed it up and I havent realized it till now. I will update the file and upload once again. But use the first dates for charting purpose.
Well, I hope that web browsers are in the domain of “any software” :). Here is a little JavaScript application that can create chart(s) after choosing a criteria. You can add more lines to the chart with the same button for the sake of comparison. You can find it here:
http://cid-7f683b8d4cbba7b7.skydrive.live.com/self.aspx/.Public/chart-js.zip
Of course it needs a little bit of optimizations but it works fine right now.
Hope you all like it 🙂 …
I know its a little ugly but if anyone wants to add a little more randomness to their data I used this.
=INT(F2+(F2*IF(RANDBETWEEN(0,1)=1,-RANDBETWEEN(0,15)/100,RANDBETWEEN(0,15)/100)))
If you want more extremes, just change the two 15’s to what ever max percentage you want. Just need to be careful you don’t get any negative numbers in your dataset.
After studying the instructions (where different ‘types’ of data are mentioned as opposed to ‘dimensions’) as well as the comments about the data so far, it is still not clear to me what these so-called ‘sales data’ actually do or should represent – turnover, or units for example, or something else. It seems to me that for an adequate graphical solution this may be of some significance, i. g. if one would want to include some sort of comaprison or similar.
Kind regards,
H.G. Lamy
Nice challenge – I suspect that lots of my time will be taken up creating an interesting data story that the data can ‘reveal’. I’m going to assume the measure is $sales, and while I’ll modify the data in the table, I’m not going to add any other variables like expenses, discounting, time to close deal, etc. I feel that this was the implication you had about us being able to change the data?
Thanks for your continued efforts on the blog.
@h.G : The data is $Sales. Please do not add more columns to the data, we have to use the existing setup to visualize.
@Alex.. Welcome to PHD. you are correct.
Thanks for setting up the challenge. This may be an incredibly silly question for someone from a non-financial background. The sales figures all seem to be increasing over time. Are these cumulative, sales per months, or it really doesn’t matter considering we can change the data anyway! 🙂
Cheers
@Brook.. The figures are not cumulative. They are actual figures. I have used RANDBETWEEN to generate the first month’s values and then multiplied these with (1+rand()/10) for consecutive months. That is why they all are going up.
Hi All,
I thought I could make up an online tool (Of course Zoho Reports) to generate the interactive reports.
Have a look at http://creator.zoho.com/gopivijay/zoho-reports-from-zoho-creator/#Page:reports and let me know your thoughts.
P.S: I am still working on this application to include other options (you will understand this once you go through the link).
@Chandoo: You can contact me anytime regarding this.
Regards,
Francis:)
Dashboard saved as PDF:
http://dl.dropbox.com/u/2137413/Sales%20Data.pdf
Dashboard viewable as HTML:
http://dl.dropbox.com/u/2137413/Sales%20Data.html
Raw data and presentation in JMP data and journal formats. Note scripts saved to data table to reproduce separate analyses.
http://dl.dropbox.com/u/2137413/Sales%20Data.jmp
http://dl.dropbox.com/u/2137413/Sales%20Data.jrn
Hi Chandoo,
Is it okay to group periods into Quarters & add calculated fields like averages?
Or are we only use the source data as is, without using any calculation/groupings of any sort?
@Geoff: It is alright to group data.
What about adding some extra metrics to assist graphing.
eg, average for a region/sales rep etc etc?? which would help with creating bullet graph etc.
@Geoff.. anything is ok as long as it is derived from the data
Hi,
This is my contribution, i have done a dashboard with charts and table.
I made somme data change, as i’m french, to have the right format for my excel version, i hope you will not have problem to view it.
Screenshot : http://bit.ly/8g0yBy
Excel dashboard : http://bit.ly/86mIAm
@Erin your top left chart is great.
Another version of my little app, modified to follow the new csv file.
http://cid-7f683b8d4cbba7b7.skydrive.live.com/self.aspx/.Public/chart-js-2.zip
I’ve created an Excel 2007 Dashboard (should work in 2003) and have tried to produce a result that’s useful, but also highlights some of the things you can do in Excel. I’ve used techniques I’ve found around the web (thank you), plus the fantastic free sparklines add-in: http://bit.ly/eKoix
Over half my time was taken up in modifying the original pseudo-random data – I wanted the data to be able to tell a story, so I created some scenarios and used multiplication factors to adjust random data to match it. Though this is involved I feel it’s similar to the way you would approach the problem anyway – “what are the issues I would like to understand?”
No new data points were added (ok, I suppose my definition of the regions are data points, plus I did add a target sales figure for each employee).
I enjoyed this challenge – thanks. Here are the files, for the sparklines to update, you’ll need to run the add-in above:
Screenshot: http://bit.ly/8gnqtC
Excel File: http://bit.ly/5o6upE
I created the dashboard in Excel 2007 as well, though I don’t think it will work in 2003 as I’ve used IFERROR that notoriously errors out in 2003.
The dashboard does use pivot tables and a lot of nested formulas, but no macros. As others have mentioned above, the data wasn’t telling any story particularly so I did a few randbetween() by region and the results were slightly better. I also arranged all the data in the various date columns into one ‘sales’ column and one ‘period’ column – which made it easier to do sum-ifs and average-ifs. There is interactivity in terms of being able to pick a different region, customer type, product and salesperson.
Other than that, I haven’t added anything else. I’ve created a landing page for the pdf, xlsx and screenshot files – here are the links.
Screenshot: http://bit.ly/DataViz2PIC
Landing Page (PDF, Excel file): http://bit.ly/DataViz2Site
Hi Chandoo,
Here’s mine:
http://rapidshare.com/files/312586959/Chandoo-Pawel.xls.html
Excel file only, as it’s kinda dynamic…
Hi All,
My modest chart (just one, no vba, no pivoting):
Screenshot: http://bit.ly/6vLJLF
Excel file: http://bit.ly/6wIEnA
Info page: http://bit.ly/90Qtgv
Chandoo – thanks for a nice challange.
@Pawel… I am not able to download your chart as RapidShare has some crazy bandwidth limitations. Can you upload your file to skydrive or e-mail it to me (so that I can upload it) ?
Hello everyone:
Here’s my entry for the dashboard.
It’s a web dashboard built using FLOT and JQuery. To deliver the dashboard, a little bit of code was created in PHP (with the CodeIgniter framework). The sample data set (and a randomized data set) were pushed into MySQL. The dashboard loads series data using AJAX. It was my first time using FLOT, JQuery and AJAX, so it was pretty fun creating it.
For the best experience, use Safari or Firefox. While still viewable in IE, the FLOT legend keys appear as sticks rather than boxes. I have tested in Firefox (WinMac), IE7-8 (Win) and Safari (Mac).
Screenshot:
http://blog.braintapper.com/assets/images/tinygrab/209e667cf6bef05f21b3368e09bea3b3.png
Live Dashboard:
http://www.phdvisualizationdemo.braintapper.com/
Summary of Design Decisions and Explanations:
http://blog.braintapper.com/2009/11/dashboard-exercise.html
Source Code:
http://www.phdvisualizationdemo.braintapper.com/source/PHD_Bundle.zip
Ok sent to you by email…
I love your dashboard! I have been banging my head against the wall for 2 weeks trying to figure out how to get the data calculations to enable the multiple selections from controls. i’m looking to do something similar and would love if you would provide the password so i can learn from your dashboard. please? 🙂
Sent you mine by email as well.
Hi Everyone,
I added a new version of my chart.
Screenshot: http://bit.ly/7QaQrm
Excel file: http://bit.ly/7w5uOq
Info page: http://bit.ly/90Qtgv
More dynamic – but lower performance (probably limitation of ‘sumproduct’).
Hello everyone!! My humble entry. No macros, scripts, addons, plugins or pivot tables. Just plain basic excel. Only tables were used for autofill.
Main self-challenge over design: Control all graphs and (what I consider) main info through a single control box, but still give the flexibility to view performace of salesperson by product or viceversa -but always being able to compare region vs. region vs. customer type over products/salespersons and observe progress of data; and was not easy without pivot tables.
Thanks for the challenge idea. It was a great great excercise. I did learn that I have to dig a lot into the database and getpivotdata formulas.
The stuff:
screenshot:
http://bit.ly/8mqGpe
file:
http://bit.ly/6FNGHF
Thanks again.
Best regards everyone.
Hi again! I was not very happy with the performance of my chart (basically with ‘sumproduct’ speed). So I changed background formulas: +1 pivot, replaced sumproduct with GETPIVOTDATA, + minimal vba to deal with pivot (very basic one) and… no more lags.
XL2003 file with macro: http://bit.ly/6d0gQu
No screenshot as chart page is not changed
Sorry for spamming with all those versions 🙂
Hi,
Here is my entry (Excel 2003) for this interesting challenge!
xls-file:http: //tinyurl.com/yd565l9
pdf-screenshot: http://tinyurl.com/ygmjlpk
Hi there,
Catch yet another one: http://bit.ly/phdchallenge
Hi,
just sent by e-mail my dashboard.
Cheers
Hi,
Here is mine.
http://docs.google.com/Doc?docid=0AZxh5PMFWIRHZGM1eHd6c2NfMTk5ZGc5dnN6ZnM&hl=zh_TW
Hi,
thanks for this second vizualisation contest in this year, chandoo!
First I didnt’t think to contribute, but the flu got me. Spending too much time on the sofa, I decided to play around with your data … to be honest: this data is really an awful bore! 😉
Nevertheless I started to model a cube with Palo and build a dashboard based on sparklines and some excel-charts. So no database-, getpivotdata- or sumif-functions are used in my solution – only Palo-functions.
The dashboard consists of three drop down boxes for the parameters month, year and salesperson and a printable section below. Every chart and table in this section reacts on the selected values of the drop down boxes.
The dashboard has to be printed out, because sparklines don’t work very well with the low monitor resolution.
Have a look at the dashboard here:
http://bit.ly/4ZsROo
Hopy you like it … I will provide the excel-file and the palo-database on my blog http://www.openbi.info at the weekend – this enables everyone to play with my solution:
just download Palo on jedox.com and unpack the accompanying database in the Palo data-folder.
Hi,
Probably 🙂 my last version this time (if Chandoo doesn’t extend deadline any more)
Latest info with all features list: http://bit.ly/90Qtgv
Excel fie (with macro): http://bit.ly/6v0UyS
Screenshot: http://bit.ly/6JEVm1
I hope you like the progress since version 1!
Hi,
Here’s my attempt – Screenshot and workbook.
Regards,
Last last update: http://bit.ly/4s3rjp
May have missed the deadline, but here goes:
http://cid-4e546fec4f1c6d0d.skydrive.live.com/self.aspx/.Public/dashboard%20submission.xlsx
I tried to focus on the objective of helping a “senior manager understand how the sales people have done in the 24 months”. Consequently many other interesting aspects of the data not directly related to this issue are explored, nor is there much support for exploratory data analysis. The main visualization uses separate lines for 2008 and 2009; the intent was to take into account the cyclical nature of sales data (although this is not evident with the randomly generated data). One major limitation of the reports that it does not explore interactions among different categorical variables (i.e. light saber sales to the galaxy in the east).
Hi all.. The contest is closed now. Please do not post any more entries, they will not be considered for the prize.
Chandoo,
News about the results? I’m very curious to see all the contestants dashboards, to get new ideas for my future ones. 🙂
All the best, Aires.
Hi Aires… Sorry for the delay. I have been busy with some work and compiling all the entries is a time consuming activity. So I kept it on hold for few days. I should be writing a post pretty soon.
Hi Chandoo,
I have sent to you an email with an excel sheet for this competition, but i cant see that here. Please give a feed back as i have participated for the first time in any competition on net.
Thanks
FASEEH.
@Faseeh… The post announcing the entries and voting will be up tomorrow. sorry for the delay, but I never expected this many entries. It is such a huge activity to compile all this info and present in an easy to understand manner for readers to look at them and vote. Thanks for your patience.
yes i agree to the article, you do a good quality writing and i look forward for the next article. please notify me when a new article published
in regard
Ich überlege die ganze Zeit schon ob ich für meine Süssen ein rutschauto kaufen soll, aber ich bin mir nicht ganz sicher ob rutschauto oder besser ein dreirad.
Right here is the right webpage for anyone who
would like to find out about this topic. You realize so much its almost hard to argue with you (not
that I really would want to…HaHa). You definitely put a new spin on a
topic that has been discussed for ages. Wonderful stuff, just excellent!