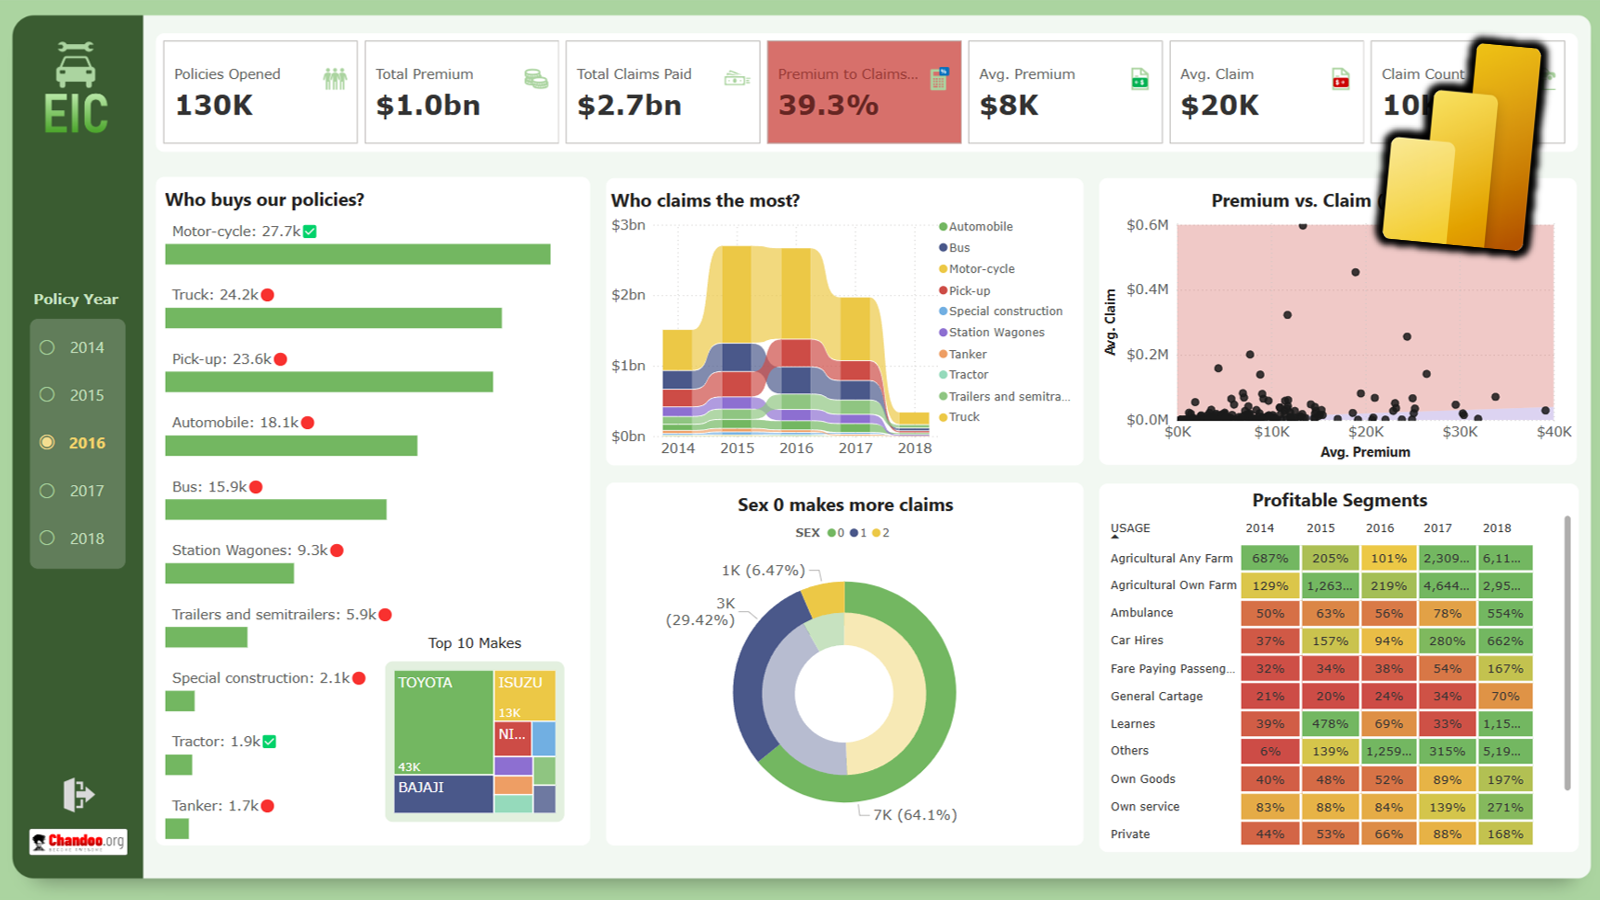
One of the easiest ways to impress your audience with Power BI is a tooltip. This simple idea can provide incredible value to the report readers and elevate your work to next level. In this easy tutorial, learn how to set up and work with tooltips in Power BI.

Power BI Tooltip
A quick demo
Step 1: Create the main visual
Create a visual on the page where you want your tooltip. Let’s say you want to show the headcount by department in a column chart, like below:

? Tip: New to Power BI? Try this getting started tutorial first.
Step 2: Add a new page and make it “tooltip” page
Insert a new Power BI report page. Click anywhere on the page and go to “format page” area, in the format pane.

Setting up a tooltip page
- Click on the “format” options
- Go to “Canvas settings”
- Set the page type as “tooltip” from “16:9”
Step 3: Build your tooltip page
On this “new” page, just add whatever visuals, images & textboxes you want to show. For example, I want to show gender & employee type distribution. So I added those visuals.
? Tip: Make sure you give your “tooltip” page a name.

Step 4: Link tooltip page to main visual
Go back to the report page. Select your main visual. Then link it to the tooltip page using below steps.
- Go to “format” and “general”
- Select the “tooltip” area.
- Set the type to “Report page”
- Select the page from the list of pages.

Voila! Your tooltip is now set up.
Bonus tips:
- You can put anything on the tooltip page and it will show up. For example, here is a fancy tooltip. It has page background color, DAX measure (with SELECTEDVALUE) to show the department name in the heading.

- Don’t show too much detail or tables in tooltips. As tooltips are ephemeral it is a good idea to keep them simple.
- You can customize the tooltip size! When creating the tooltip page (step 2), you can use “Custom” as page size and set up a different size or shaped tooltip.
- Use tooltips to show helpful hints or messages. You can get creative with tooltips by linking them to a card or table visual to show help messages, explanations or other useful text. See this demo:

Power BI Tooltips – Video tutorial
Here is a short & sweet video tutorial of this process. Do watch it, if you need any help.
Try tooltips (here is a sample file)
So what are you waiting for? Give them a try.
If you need a hand with the tooltips, here is my sample Power BI workbook.
Learn more about Power BI
Want to learn Power BI? Check out below articles + videos.
- Introduction to Power BI and your first project (article + files)
- Getting started with Power BI (video + files)
- How to use Power Query (article, 4 practical examples + files)
- Full course on Power BI


3 Responses to “How to create interactive tooltips in Power BI (step by step)”
I have a situation where the main report and tooltip I want to show are different tables. They have a 1-M join (1 for the main report). Also, the main report is a pivot. The filters are no passing through in this case. I am not sure what the cause is. Any ideas for this?
Ideally, I would like the join to be an inactive join because of other requirements in the report. Is there a way to make this tooltip report work through an inactive join?
This is not an interactive tooltip. This is a page with a custom tooltip.
Hi !! I am getting this error - mdxscript(model) (3,35) calculation error in measure : the function sum cannot work with values of type string.
This is from your free Power BI course on Youtube 9th video 59th Min. How can this be resolved. I downloaded the sample files present in the description.