
In this blog post, let’s go the very basics of it all.

What is Power BI?
Power BI is a software to create and publish interactive, web-enabled reports & visualizations for your audience. You can use Power BI on a PC or web to create things. Once you publish a report (or few visuals), your audience can consume them by using any device – PCs, Macs, Web browsers, Apps on cell phone / tablets etc.
Here is a more detailed tutorial on Power BI.
Demo of a Power BI report & interactive experience:

How is Power BI different from Excel?
So what, even Excel can create interactive reports. But there are several crucial differences between Power BI and Excel.
- Power BI allows rich, immersive and interactive experiences out-of-box. You can click on a bar in bar chart & other visuals respond to the event and highlight or filter relevant data. You can show graphs & visuals that are very tricky (or impossible) to reproduce in Excel like maps, pictures and custom visuals.
- Power BI works with large data sets There is no artificial limit of 1mn rows in Power BI. You can hookup to a business data set and analyze any volume of data. The limit depends on what your computer (or Power BI server) can process.
- Share and read reports easily You can create reports in Power BI and share them in formats that are universal (ie browser pages or apps). This means, your boss need not have Excel or Power BI installed to enjoy the beautiful reports you create.
- Power BI is for story telling while Excel is for almost anything. We can use Excel to simulate pendulum motion, calculate Venus orbit, model a start-up business plan or many other things. Power BI is mainly for data analysis & story telling. If you try to replicate a large, intricate financial model or optimization problem with Power BI, you will either fail or suffer miserably. On the other-hand, if you use Power BI for making reports, running cool analysis algorithms (clustering, outlier detection, geo-spatial patterns etc.) you will wow your colleagues and bosses.
How to get Power BI?
Power BI is free for individual use. Just head over to PowerBI.com and download the free desktop application (or get Power BI app from Windows store)
If you want to share your reports and work as a team, then you need a paid Power BI plan. PowerBI.com has useful information about this.
Note: Power BI is updated frequently. If you install it as an app, then Windows will automatically update Power BI when there is a new version. If you use Power BI desktop thru normal install, then you need to update it once in a while to use new features.
What is Power Query?
Power Query is a data processing & mashup software. We can use Power Query to
- Connect to several types of data sources (databases, files, web pages, social media, APIs, cloud storage etc.)
- Bring and combine data (append, merge, join etc.) from various places
- Derive new columns of data
- Format, remove or reduce data
- Reshape data (transposing, grouping, pivoting, un-pivoting and other creative ways)
- Write formulas to do advanced manipulation of data
- Publish refreshable datasets
Here is a detailed tutorial on Power Query.
The output of Power Query can go to either Excel or Power BI. That is why Power Query is available in both of these software.
Think of Power Query as a strange (but super-helpful) combination of SQL, VBA, Excel formulas and pixie dust. It gives us (people working with data) freedom to focus on real problems than worrying about issues like:
- where is my data?
- Is the data clean?
- What about missing values
- What if everything I need is not in one place
- <insert your data pain here>
Demo of what Power Query can do:

How to get Power Query?
In Power BI:
Power Query is an part of Power BI. So there is no need to get Power Query. It is always there. Just click on “Get Data” button and you enter the Power Query world.
In Excel:
- Excel 2016 / Office 365: has Power Query by default. No need to get anything. Just go to Data ribbon and use the “Get & Transform data” options to set up Power Query connections.
- Excel 2013 & 2010: You can install free Power Query add-in. Just download it from Microsoft Power Query website and you are good to go. You may need to enable Power Query from COM add-ins in developer ribbon.
What is Power Pivot?
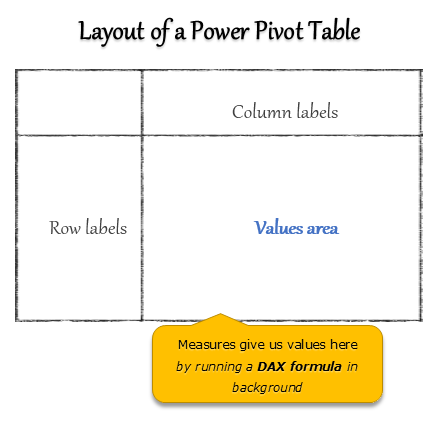
Power Pivot is a calculation engine for pivot tables. You can use Power Pivot to model complex data, set up relationships between tables, calculate things to be show in value field area of Pivot tables / pivot charts or visuals.
Think of Power Pivot as a calculation layer between your data and outputs. You can tell Power Pivot how you want your calculations done thru a language called as DAX and Power Pivot can give the answers. It is an extremely fast & scalable software.
We can use Power Pivot in either Excel or Power BI.
How to get Power Pivot?
In Power BI:
Power Pivot is an part of Power BI. So there is no need to get Power Pivot. It is always there. You can use various features of Power Pivot from Modeling ribbon and from data & relationship views.
In Excel:
The present Power Pivot availability and licensing model is more complex than DAX. Let me try to highlight the key points. A good place to check is where is Power Pivot page by Microsoft.
There are two kinds of Power Pivot for Excel.
- Power Pivot engine: this is necessary for calculating values in pivot tables. It is available in Excel 2013, 2016, Office 365 and future versions of Excel.
- Power Pivot creator: this is necessary for adding new kinds of measures, managing data model etc. This is currently available only in certain types of Excel (professional, professional plus versions). From Excel 2019, this will be available in all kinds of Excel.
- Excel 2016 / 2013 / Office 365 Pro versions: Power Pivot is available in professional & pro plus versions. No need to download anything. Just enable Power Pivot COM Add-in and you are good to go.
- Excel 2013 & 2010: You can download free Power Pivot add-in from Microsoft and install it to use Power Pivot.
How Power BI, Power Query and Power Pivot are related…
Here is a simple diagram explaining how these 3 powerful software are related.

Getting started with Power BI, Power Query and Power Pivot…
If this is the first time you have heard of any of these tools, I suggest checking out below tutorials.
- What is Power BI, a deep and clear introduction with full tutorial
- Getting started with Power Query – Introduction + video
- What is Power Pivot and how it can help you – Intro video
Additional resources to learn about these tools:
- Best Excel & Power BI books
- Excel School online course – Power Query & data modeling is covered
- What is Power Pivot & why you should care [Matt’s blog]
- Power Pivot tips & tricks from Ken [Excelguru blog]
- Power BI blog [Microsoft Power BI team]


11 Responses to “What is Power BI, Power Query and Power Pivot?”
FYI - Microsoft has made decision to make PowerPivot available to ALL SKU of Office 365 subscription (and likely 2019). I believe you'll need to set Update Channel to Office Insider.
https://excel.uservoice.com/forums/304921-excel-for-windows-desktop-application/suggestions/9018823-make-power-pivot-available-in-all-versions-of-exce
I need 100 million rows of worksheet. Can you advice me something.
Mehmet: Excel will not be able to store more than 1mil rows of data. You could potentially do it in Data model, but it isn't recommended.
There typically is no reason to load all 100mil rows of data for dashboard/analysis. You'd perform aggregation as the data is brought in via PowerQuery (Select... Group By etc).
If you really need to load raw data of 100 mil rows. I'd suggest you consider using R or Python using dataframe to store your data and perform analysis. Do note, this will likely require very powerful machine with ample RAM.
Power BI!
More needs to be said about that email restriction. To truly collaborate, everyone needs to be on the same email domain, and it can't be gmail, yahoo, etc.
Small companies that use gmail as their email ... sorry!
To truly collaborate with Excel, Power Query or Power Pivot, just sit the thing in a Dropbox or OneDrive folder. BOOM! COLLABORATE!
Hello,
For a couple years I have been a subscriber to your newsletters and now I am finally able to take some time to participate in Excel School. Can you tell me if the 2 offerings Excel School & Excel School Dashboards are completely separate or does the class with Dashboards include the 1st?
My excel skills are good, but I'm not an Excel Jedi master.
And although I assume you will reply before the class signup deadline, know that I am attempting to sign up today. Thanks.
Olga
Hi Olga,
Thanks for your comment. 🙂 Excel School Dashboards includes everything in Excel School. I hope that helps you make a decision. Let me know if you have any other questions.
Dear Chandoo,
I have EXCEL 2007. Can I join the EXCEL 2.0
Please suggest
Regards,
Chandrasekar
Hi Hui,
Can you please guide me : I have created a data model in Excel using Power Query and Power Pivot.
Now, i have used it in a Power BI using 'Import" feature feature.
Now, once i refresh the old model in excel, how can i import the same in Power BI again keeping my visuals intact?
I have purchase Project portfolio from your website.
Can you please guide me to change the gantt chart dates as it is only till 2016
What an amazing post! I always look forward to reading your posts.
They are so engrossing and well-written. The way you consider your readers' preferences and leave a hint of personally relatable experiences is simply exceptional. There are always a few lines in your posts that stick with me and keep me hooked on your writing. Reading one of your blogs immediately makes visitors want to read another and share it. This post was wonderful, and please continue to share such blogs in the future.
I believe that my expertise in the field in which you write will be very beneficial to you. You can get a sense of my writing style by browsing through my high-quality content.
thanks for the very informational article please keep them coming thank you so much