
Last week at the Chandoo.org Forums, MarnieB asked:
“I have been asked to produce a chart that looks like the spokes in a wheel. Lines for each data point that start from the same point in the middle and go out in different directions. The length of the line indicates the value of the data point. There are only 5 or 6 data points.”
Lets see how we can produce such a “Spoke Chart” in Excel.
Disclaimer: Before I go too far I want to say that this post isn’t recommending the use of this type of chart. The post is about introducing techniques which you can use as the basis of many custom chart types. The post just uses this chart as a simple example.
EXCEL CHART TYPES
Excel doesn’t have a native Spoke Chart in its catalog of built in Chart Types.
As MarbnieB found out, Radar Chart give some level of simulation, but there not ideal for what MarnieB’s boss wanted.
Luckily for us Excel has a Scatter Chart and this chart type can be used as a veritable drawing board for your own purposes.
The Scatter Chart draws lines between sets of coordinates in the X-Y plane.
Typically Scatter Chart are used for Plotting two variables against each other where neither the X or Y axis has a regular occurrence frequency,

But Scatter Charts can also be used for adding custom chart types as we will see below.
MARNIEB’s SPOKE CHART
Lets look at MarnieB’s specifications:
- It should have 5 or 6 spokes
- Spokes radiate out from a central hub
- The length of the spokes should reflect the spokes value
So it will look something like this:

(Not drawn to scale)
We can imagine that the center of the Spoke is at a position X=0, Y=0 or (0, 0) on the Cartesian plane.
We can then break up a circle into a number of segments n. MarnieB’s requirements n = 6.
As a full circle is 360 degrees we can see that each spoke will be separated by 360/6 = 60 Deg
Hence there will be spokes at:
- 0 Deg
- 60 Deg
- 120 Deg
- 180 Deg
- 240 Deg
- 300 Deg
The length of each spoke will be supplied by MarnieB.
We can use the Scatter chart to plot each Spoke as a separate series on the scatter chart.
Each series will consist of two points, being the center point (0, 0) and another point at the end of the spoke (x, y).

We will need to determine the X and Y values for each end of the spoke.
Using some simple trigonometry we see that:
X = Length * Cos ( angle )
Y = Length * Sin ( angle )

Now we know the angles and lengths and so in Excel we can setup a small table to calculate the X, Y values for each end of the spokes.
Using Excel we need to remember that Excel requires angles in radians. This just requires a simple modification to the formula to:
X = Length * Cos (Radians( angle ) )
Y = Length * Sin (Radians( angle ) )
Setup the Chart Series
Before we jump in you can follow along this example using a new Excel file or the worked Example File, Excel 97/03, Excel 07/10.
As mentioned above each spoke will require two points
Point 1, The center of the spoke at 0,0 and a point at X, Y
In Excel we setup a small table of the Inputs including the Point Id, Angle and Length

We can then add some formulas to take the inputs and convert them to X, Y Cartesian coordinates using the formulas described above.

Putting the Chart Together
Once you have the Spoke coordinates you can construct the chart
With NO data selected, goto the Insert Ribbon and select Scatter, Scatter with Straight Lines
A blank chart will appear on the Screen

You can resize and shift the chart to a useable location if you require.
Right Click on the Chart and select the Select Data option

The following dialog appears:

Select the Add, button and the Edit Series dialog appears.

The Series Name: is linked to the Spokes Name $A$4
The Series X values: is linked to the two Chart X values: E3:E4
The Series Y values: is linked to the two Chart X values: F3:F4
Ok when complete
You can now go ahead and add the other 5 Series to the chart by selecting the Add button.
Your Select data dialog will now appear like:

And the chart will appear something like:

Cleanup and Format the Chart
We now need to clean up and format the chart
Select and Delete the Charts Title, Chart Legend & Horizontal Grid Lines
Select Each Axis in Turn, Right Click and Format Axis
Set the Minimum and Maximum values to something greater than our data eg: -20, +20 in our example. The Minimum and Maximum for the Horizontal and Vertical axis bust be the same so that the chart scales correctly.
Resize the Chart so that it is approximately square
Leave the axis for now, it is simple to delete them later

Select each spoke in turn
Right Click and select Format Data Series
Set the Marker Options, Marker Fill, Line Style, Line Color to suit your preferences
If you want to add a marker to one end of the line, Select the line, then use the Right/Left arrow keys to select the end you want, Ctrl 1 to Edit the Format of that end only.
Your chart should now be something like:

Add Data Labels
Select each spoke in turn using the Up/Down arrows, then using the Right/Left Arrow keys, select the outer end of the Spoke
Right Click and Add Data Label
A Default value will appear which is the Y Value for the data point

Right Click on the Data Label then select Format Data Label or simply press Ctrl 1
Unclick the Y Value and Tick the Series Name
Repeat for each Spoke.
You may want to change the alignment for some of the Data Labels so they don’t clash with the spokes.

Add Circular Grid Lines
Lets add 3 Grid lines at a Maximum value and at 1/3rd and 2/3rds of that value
First we need to calculate the Grid Values
In cells C22:C24 I added 3 formulas

I have then assigned 3 Named Formulas to the 3 cells
Max_Circle: =$C$22
Mid_Circle: =$C$23
Min_Circle: =$C$24
To make a circle on a Scatter Chart we will need some points for the X and Y values for each point around the circle
To achieve this I will use a few Named Formulas:
t: =RADIANS(ROW(OFFSET(‘1’!$A$1,,,361,1)))
X_1: =SIN(t)*Max_Circle
Y_1: =COS(t)*Max_Circle
X_2: =SIN(t)*Mid_Circle
Y_2: =COS(t)*Mid_Circle
X_3: =SIN(t)*Min_Circle
Y_3: =COS(t)*Min_Circle
Lets look at a few of these and see what is going on:
t: =RADIANS(ROW(OFFSET(‘1’!$A$1,,,361,1)))
This formula sets up an Array of 360 values from 1 to 361, corresponding to 1 degree to 361 degrees. This occurs using the formula: = ROW(OFFSET(‘1’!$A$1,,,361,1)) which takes the Row value of an temporary range which is setup from cell A1 and offset 0 Rows, 0 Columns and is 361 rows high and 1 Column wide.
In a blank cell C27 type: = ROW(OFFSET(‘1’!$A$1,,,361,1)) press F9 not Enter
Excel will display ={1;2;3;4;5; … ;355;356;357;358;359;360;361}
1 number for each row, which will be used to represent the degrees of the circle
In a blank cell C28 type: =Radians( ROW(OFFSET(‘1’!$A$1,,,361,1))) press F9 not Enter
Excel will display ={0.0174532925199433;0.0349065850398866;0.0523598775598299; … ; 6.2482787221397;6.26573201465964;6.28318530717959;6.30063859969953}
The same array of Degrees now converted to Radians
You can learn more about how this style of formula works by reading the Formula Forensics Series where a number of similar formulas are used.
We can now use the Array of Radians to feed the Formula for the X and Y values
Looking at X: the X value of each point will be X = Circle Radius * Cos( t )
Where t is our array of Radians
So for Circle 1, the Maximum Circle the X Values will be
X_1: =Cos(t)*Max_Circle
In a blank cell C29 type: =COS(t)*Max_Circle press F9 not Enter
Excel will display ={14.9977154273459;14.9908624052864;14.9794430213186; … 14.9908624052864;14.9977154273459;15;14.9977154273459}
This is an array of the X Values of the Maximum Circle, all 360 of them.
You can check out the other X and Y values for the other circles yourself.
To add the Circular Grid lines to the chart, Right Click on the Chart, Select Data
This is the same Dialog we saw earlier
Select Add

Series name: =”Max Circle”
Series X values: =’1′!x_1
Series Y values: =’1′!y_1
Note: that we have added the worksheet name and the Named formula to the Series X and Series Y value fields. This serves to reference the Named Formula to this worksheet, sheet “1”.
Select Ok and add the Mid and Min Circles in a similar manner.
Your chart should now be similar to this:

Add Grid Annotation
Add Grid Annotation by adding 3 more series to the chart, 1 series for each annotation point.
We can put a point at the intersection of the 3 circles and the X Axis because we know the radius and the Y value = 0 so the 3 points will be at
(Min_Circle, 0)
(Mid_Circle, 0)
(Max_Circle, 0)
Once again Right Click on the Chart, Select Data
This is the same Dialog we saw earlier
Select Add

Series name: =”Min Annotation”
Series X values: =’1′!Min_Circle
Series Y values: ={0}
We can note that we have used the Named Formula for the Min Circle value as the X Value and that we have used a constant array for the Y value of 0.
Repeat this for the Mid and Max annotation points.
Format the Annotation Points
The 3 points you have just added to the chart may or may not be visible
The easiest way to find them is to either
Use the up/down arrow keys to scroll through the Chart series until you see it selected
Or
Select the Chart
Goto the Chart Tools, layout Ribbon and select the Min Annotation series from the drop down list:

If there is a marker showing, set the Marker Style to None
Close the Format Dialog and Right Click on the Marker, Add Data Labels
Select the Data Label and Change it from the Y Value to the X Value
Also change the Label Position to Above

Resize the Chart
Right Click on the outside of the Chart and select Format Chart Area
On the Size Tab, set the Height and Width to the same value

Select the Horizontal Axis and Delete it and repeat for the Vertical Axis
Your chart is now complete

DOWNLOAD THE ABOVE FILE
You can download the Example File used above: Excel 97/03, Excel 07/10.
OTHER CHARTS DONE IN EXCEL USING SCATTER CHARTS
As you have seen above the Scatter Chart can form the basis of your own custom Charts with the results being limited by your imagination.
Presented below are three Scatter charts where the authors have taken Scatter Charts to the extreme.
Hui’s – 3D Pendulums
In 2011, I produced an animated Scatter Chart consisting of 18 x 3D Pendulums in Excel which includes the ability to rotate the chart whilst the pendulums are swinging.
This is a Scatter Chart that consists of about 22 series, 18 for the Pendulums and a few others for the Frames and Axis.
The maths behind the pendulums locations and the rotations is all done via named formulas with a very simple macro driving the animation.
http://chandoo.org/wp/2011/07/06/3d-dancing-pendulums/

Excel Hero – Smith Chart
Daniel Ferry at Excel Hero.com has produced what I consider one of the most amazing charts in Excel I have ever seen.
I don’t make this statement just for the actual modelling of the Smith Chart or the use of Excel and Named Formulas in particular but also for the sheer Beauty that is displayed in the finished chart.
http://www.excelhero.com/blog/2010/08/excel-high-precision-engineering-chart-1.html

Frankens Team
The Frankens team has published a number of strange charts with a lot of them based on Scatter Charts.
https://sites.google.com/site/e90e50fx/home/creative-and-advanced-chart-design-in-excel

Please note that some of these charts use advanced excel techniques and are not for the feint hearted.
Yes the 3 charts above are all Scatter Charts, illustrating the incredible diversity that can be achieved using this tool.
WHAT CHART STYLES WOULD YOU LIKE TO SEE ?
What do you think of the techniques discussed above ?
What chart styles would you like to see ?
Let us know your thoughts to the above in the comments below:


92 Responses
This is an amazing post. Many thanks.
A great problem with radar charts is that people interpret them as areas not as spokes. Even Stephen Few, who doesn’t hold back his adverse opinions on circular presention of data, likes the OECD’s use of small multiple spoke-charts (flowers)
http://www.perceptualedge.com/blog/?p=1044
Dear Chandoo….
You are amazing just like a magician. Where you have learned this? can you tell me the secret
@Vijay… This is written by Hui, who is a magician as well. In fact a better one than I am.
I do not call a chart a scatter plot just because creating it includes using Excel’s xy chart.
@Naomi
Microsoft has used the terms XY and Scatter interchangeably in various Excel versions refer: http://msdn.microsoft.com/en-us/library/ms251748%28v=vs.80%29.aspx
This is a Scatter chart in the true sense of the word, It is showing the scatter of 6 series of data which have a common point of reference. Ideally the direction of each series should also mean something, but that was never disclosed by the origin post.
The fact that it is emulating a “Spoke Chart” is only in the eyes of the beholder.
I am surprised that so much work needed to plot this…Really amazing but as suggested i am not going to use it…..To much background work to present data in a way which is asked by BOSS without giving a reason….for why to plot…
Hats off to Hui….to make someone’s dream reality…
@Kuldeep
Thanx for the feedback
It isn’t a lot of work, when you get down to it.
I try and write posts that introduce new or different ways of doing things or thinking about problems using Excel.
I could have left the Circular Grid Lines and Annotations out, but it just seams like a natural progression and introduced a few new techniques to readers at Chandoo.org.
Wait for the Jon Peltier to come here and show his hate !
Not hate, just guidance. I also used to like to create seemingly impossible charts, but that was being a mechanic, not building an effective display.
This spoke chart is not conceptually different from a radar/spider chart. Clever to make and even attractive, but less effective than it seems at first glance.
There are many ways to present this data that are easier to interpret, easier to understand, and easier to compare. For example, horizontal or vertical bar chart, line chart, dot plot. In these cases, the data is encoded by length of a bar or distance from a baseline, but all in the same direction. When we are forced to interpret lengths or distances which are not parallel, we might find the display attractive, but we also will not be able to make instant precognitive comparisons.
And how to we compare two sets of six values? If we use a dot plot or a parallel coordinate plot, we can place two or more (often many more) sets of data, and compare them much more easily (i.e., precognitively) than if we have an array of these windmills.
“And how to we compare two sets of six values?”

Sorry, that seems twice as hard to read as with one set of spokes. But a line chart with two series is hardly any more complicated than one with a single series.
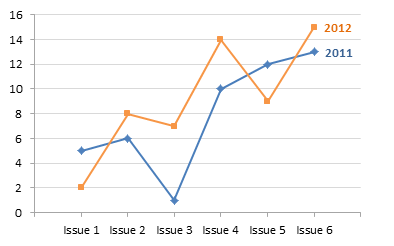
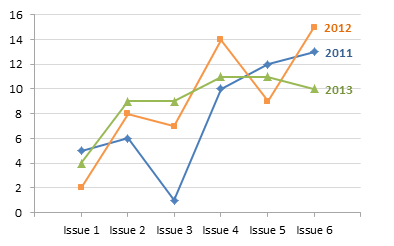
And one with three series is hardly more complicated than that.
I’m assuming I can use image tags here.
I would personally use a standard (Clustered) Column Chart or a Line Chart without the lines, just the markers for MarnieB’s data
The lines imply a connectedness between the Issues, which I’m not sure is there
Okay, image tags didn’t work, but you can still follow the urls.
Jon
I fixed up the tags
the format is
<img src= “URL in quotes”/>
I think i just removed the space after the final ” and before the /
The URL is to be in Quotes, not the quotes shown above
Hui – Thanks for fixing the tags. In fact, WordPress seems to like the space between the quotes and the slash. But sometimes WordPress only allows admin level users to insert pictures. For good reason, I’d say.
@Peltier…. loll true but who r u??? Hui allways a fan of u :)..thnx….
Appreciate 🙂
Great post.
I would like to create a Box plot chart (as used in Statistics) for sets of data. If these charts could be referenced by criteria this would be very useful.
Hui…well spoke, sir. (Can’t believe no-one beat me to that)
Jon, you’re right of course that there are many ways to present this data that are easier to interpret, easier to understand, and easier to compare. That said, none of them gets one a good mark on one’s performance appraisal under the question “Staff member does what I ask them to do, quickly”. 😉
I know, I know…the ‘just following orders’ approach doesn’t excuse you from the moral fact that you are committing crimes against Data Visualisation. Maybe a good opportunity here for MarnieB to produce the spoke chart in order to look raise-worthy, but at the same time present it to his local dictator along with some better alternatives and hope said dictator makes the right choice. Alas, dictators so rarely do…which is why you should become your OWN dictator wherever possible. (Exactly why I’m angling towards being self employed…if I’m going to take orders from an idiot, that idiot might as well be me).
Mind you, why settle for ONE spoke chart when you can have SIX Speedometer charts, and hence look six times as cool!
I was never good at “just following orders”, especially when said orders made no sense. I also have a low tolerance for incompetence. (One boss frequently asked what was the definition of “standard deviation”. Once I replied, “Where did you get your PhD?”) So I was really a poor corporate employee.
But in my own corporate environment, I take orders from an idiot I get along with quite well. (I like that turn of words, Jeff, so I’m probably going to steal it.)
I do not mean to demean Hui’s or anyone’s efforts, but we should know better. People should not be encouraged to do the wrong thing. We have their attention, let’s try to what should be done to effectively present information, not what could be done if only we know what buttons to tweak.
@Jeff, Jon
Obviously you missed reading my Disclaimer right up near the top.
No, I saw your disclaimer. But I’ll bet many of the other readers just went to the pretty pictures you dangled in front of them. You’re sending mixed messages: you shouldn’t do this, but here’s how.
When I tell people that a particular approach is not advised, I present them with better alternatives.
Jon..chart-bling can be in the public good. So dangle away, I say.
Say my boss says “Give me a speedo chart”. What do I do? I google “Speedo Chart”, of course. What does Google do? Serves up the “Speedo Chart” page with the most Google juice. (From this very site, no less…congrats, Chandoo…you’re like the Elvis of speedo charts 😉 )
Meanwhile, in the alternate universe (where I’m spending a bit toooo much time), Jon Peltier has yet to remove the Speedo chart he had on his site (back in this universe) some time back. In that alternate universe I do a Jeffgle search (that’s right, I started the worlds most profitable search engine “Jeffgle” in that universe. I also own the prevelent social network – FaceAche – in that universe.)
Jeffgle returns a site right at top of the search listings that NOT ONLY gives me the best darn lookin Speedo Chart in the easiest-to-implement Speedo Chart Template possible at the speed of light from some dude called Jon, BUT ALSO carries Jon’s impassioned and well-reasoned public service announcement warning against their unsavory after-effects, and offering alternatives. Unlike the next listing down, from someone called Pointy Haired Elvis, which just gives me the Speedo Chart and says ‘Have at it, folks’. 😉
So go on Jon, get that speedometer graph back on your site. It’s in the public good, and you owe it to this universe’s humanity. Even if you lose a little of your own in the process.
Sorry, forgot to close that comment off with a 😉 just to make sure this is half in jest. Just half, mind.
That speedo chart, a relic of my foolish youth, is long gone from my site except for a note why you shouldn’t use such charts.
Jon, I hear you, I hate ugly /wrong charts too.
But Excel by default has some ridiculus charts that can be misused and can represent the data all wrong. I mean, you can make a radar chart with much less hassle and it would be just as wrong.
That’s why I think this post is great. It doesn’t just say “here is the file, just change the data and put it in your presentation”, but it goes into detail how it is built, and in sparks an interest into what else could be done with similar methods.
Jon, you couldn’t stop this chart from happening, it would get done either way, with Hui’s idea or drawn by hand in Paint 😛
Thank you Hui, great post as always!
Jon, I managed to find a picture of that very speedo chart on the Internet Archive site:
http://screencast.com/t/DFltNlZ2
Jeff –
He he he. My days of wearing speedos are even further behind me than my days of making speedo charts.
Yeah, I saw the disclaimer too. Wasn’t a dig at you or Jon, but just a tongue-in-cheek observation that sometimes we have to balance what is ‘right’ against what is ‘ordered’.
I prefer to produce charts in line with Tufte, Few, Peltier *grin* where I can, but if someone ‘important’ has their heart set on a bling chart – and it’s only going to go into some dashboard who’s sole purpose is to make the unit look like they do something important – then I’ll dish them up a bling chart.
Daniel Ferry did a similiar (not the same, but similar) chart in his last newsletter. I couldn’t find a link and don’t want to reproduce without permission, but it’s worth a look if you’re interested in this type of thing.
Like some of the commenters above, I don’t get much call for anything this pretty in my line of work. Lots of number crunching and occasional graphs, but usually prettty straightforward. It’s good to know that it can be done though. It’s amazing what excel plus imagination and effort can produce.
Terry
I think you were thinking of: http://www.excelhero.com/blog/2012/05/excel-formulas-can-make-a-graph.html
That’s it. Thanks
Hi Hui,
I like the idea … just … I think it would be better to use a single serie … in this way it is possible to create dynamic chart … You can add new data with automatic update … what do you think?
… p.s.
thanks for sharing the link to our article 🙂
r of Frankens Team
R
thank for the comments
A single series would make it much more difficult to color each spoke if that was required
A while back, Tushar Mehta was kind enough to offer advice on a chart I was trying to create. His advice was along the lines of, “Yes, you can do it. But just because you can do it, it doesn’t mean it should be done.”
Jon – spoke charts are conceptually different from radar/spider charts. Most readers instinctively interpret the latter in terms of area enlcosed not in terms of pure length of axes.
Personally I find Hui’s double dataset version very easy to read. In your line/scatter version you connect data items between separate categories of data, which is surely the worst presentation practice of all (on a par with 3D pies in my opinion) . Remove the lines and your version would be fine, but for the two-series version wouldn’t the arrow charts you so brilliantly described on your recent blog post be better?
The lines make it easier to track a given year’s data across all categories. If you like, the line can be lightened or omitted, but I doubt most people would see the lines between the markers and think there is valid data at “Issue 4.3”. Well, most people below the level of director.
The double spoke chart is nice to look at, but it requires conscious thought, eye switching between legend and spokes, and remembering previously decoded values to sort out years and values. The line chart is decoded without conscious thought, which can then be devoted to analysis.
Perhaps what needs concious thought to decode and what is decoded without it vary between readers.
i like your comment about directors, but mine (a Director of Public Health) has a background including som eyears as a (Full in US terms) Preofessor of Epidemiology, an dhas higher satdards of numeracy and graphicacy than most
I’m sure different people do find different visuals easier or harder to interpret. However, it is known that certain characteristics are processed precognitively, that is, without intervention by the conscious mind. Other characteristics simply make it easier for the conscious mind to make sense of a graphic. I try to be aware of such characteristics while creating and reading graphics, and it is on this basis that I make my comments.
I worked under a wide variety of managers, directors, and vice presidents during my corporate career (which fortunately is behind me: I didn’t fit in). The (vast) majority were literate and capable of numerical thought. However, the director at my last “real” job was a total ignoramus. We called him the “duh-rector”. We’ve all worked for one or two of these, and they spoil it for all of the good ones.
@Meic. Re your comment In your line/scatter version you connect data items between separate categories of data, which is surely the worst presentation practice of all (on a par with 3D pies in my opinion)
This is called a Parallel Coordinates Plot, and even gets the thumbs up from Stephen Few:
http://www.perceptualedge.com/articles/b-eye/parallel_coordinates.pdf
Sorry – Cant focus. Too dazzled by the pretty pictures dangled in front of me. Brain can’t comprehend beyond colorful image. Ohhh! Ahhh!!!
The axes are parallel to one another in a parallel coordinates plot. Jon’s plot has the usual perpendicular axes. It is NOT a parallel coordinates plot. It is a standard line plot (even if one needed to use an XY plot in Excel to create it.)
I don’t believe that the terminology of a plot should depend on the software used to create it so I strongly disagree with Hui that some of his early figures above are scatter plots. The name of a plot should be determined by the eyes of the beholder and not particular techniques in one software program used to draw it.
I actually did use an Excel line chart, but whatever.
But my chart could be a parallel coordinates chart. At least it is the beginning of that form. If Issue 1 were an employee’s attitude rating, Issue 2 his communication skill, Issue 3 his skill at a given task, then it turns into HR parallel coordinates. Or if it’s gross vehicle weight, fuel economy, wheelbase, retail price, then it’s an automotive purchase decision parallel coordinate chart.
If Issues 1 through 6 are marks on exams during the semester, then I guess it’s not parallel coordinates.
I don’t think we need to get too caught up in semantics. If a chart is effective or not, that’s what’s important.
Your chart has a horizontal axis and one vertical axis that that is used for all the issues. Vehicle weight, fuel economy,wheelbase and retail price would not be plotted on the same axis.
Naomi –
True, I didn’t construct an axis for each category. Would using a single normalized axis (0 to 100%, say) make a chart not parallel coordinates?
Stephen Few’s example that Jeff linked to has a single normalized axis. The chart as you drew it was a line chart with perpendicular axes. A parallel coordinates plot is a multivariate plot with parallel axes. I have never seen one with the axes implied rather than shown.
Naomi, if that’s not a parallel coordinate plot, then neither is the chart that Stephen Few uses to explain what a parallel coordinate plot is in the PDF that I linked to, or the one in his book “Now you see it”, or this image at Wikipedia under parallel coordinate charts:
http://en.wikipedia.org/wiki/File:Ggobi-flea2.png
If Jon was to repeat the axis for each ‘issue’, would that make it a parallel coordinate chart in your view? What if he were then to delete those extra axis because they are redundent? Does it suddenly stop being one?
To me, this absolutely qualifies as a parallel coordinate chart. It plots vales associated with entierly different variables, and uses a line that intersects each axis at the point where the product’s value for that variable is located along the scale.
Regardless of what we actually call it, it IS a valid statistical technique, and not as Meic states above ” surely the worst presentation practice of all (on a par with 3D pies in my opinion)”
As Jon pointed out, we’d have to know what Issue 1 represented before we could tell if this could be made into a parallel coordinates plot. Are the issues different values of one variable or are they different variables?
I would not use the term “repeat the axis” since that sounds as if it is the same axis. Rather, to be a PCP, we’d insert an Issue 1 axis, an Issue 2 axis, etc. These need not have the same scales. These axes are not redundant since they represent different variables and may have different scales. Often each variable is plotted from its minimum to its maximum. I’d also remove the horizontal grid lines if I wanted to turn this line plot into a PCP.
I attended a session at statistical meetings one year where parallel coordinate plots were used in a classification problem. It was amazing how these plots enabled archeologists to classify objects that had been disputed for years. They certainly are a valid statistical technique.
I believe Meic was discussing if a plot with a categorical variable and a quantitative variable can have the points connected when interpolation does not make sense. I respect many people who feel, as Jon does, that the lines help the eye to follow the points. I also respect many experts who disapprove of this practice.
Naomi – you put my point exactly. The lines may occasionally help in this way, but at the cost of misleading a substantial proportion of their readers.
I’d hypothesize that a spoke chart is as potentially ‘confusing’ as a parallel coordinate chart is potentially ‘misleading’.
I can’t see how ‘Issue 1, Issue 2, …Issue N’ could be anything but different variables.
If they were different values of the ‘Number of Issues’ axis, then they wouldn’t be notated ‘Issue 1, Issue 2, …Issue N’ but rather ‘1 Issue, 2 Issues, … N Issues’
Although I can see that ‘Defcon 1, ‘Defcon 2′, …’Defcon N’ couldn’t be considered a parallel coordinate plot.
But I’m splitting hairs here. Important point is that as you point out, this kind of approach is considered acceptable by some where you are not interpolating values between points.
Cheers
Jeff – We could be plotting the number of pages in different issues of a magazine. Then the issue number might correspond to the date the magazine was published and be different values of the same variable.
In short, a line plot is bivariate and a parallel coordinates plot is multivariate.
I’m starting to think:
1. Discussions about Chart types are nearly as emotive as Politics and Religion and definitely more than Climate Change
2. Do I really want to keep publishing alternative Chart Type posts?
The answer to question 2 is a definite “Yes”.
If we shut our minds to alternatives we stop growing and who knows, the Spoke Chart and Stacked Spoke Chart presented above may have a legitimate use for somebody or some application.
3. I’d really like to hear from MarnieB’s boss, to see if it solved his problem
Hui,
I am 100% with you!
Please keep publishing alternative Chart types!
I am always impressed by the possibilities of Excel’s limited chart types. Using these limited resource and create something new – it is only possible with an exceptional and really creative brain.
How do you like the context of haute-couture vs. pret-a-porter in our Frankens Team article? This was my answer to the critique.
And… I think it is not my business to decide if the chart is effective or suitable for a situation. It is the user’s responsibility. My responsibility is to draw the user’s attention to consider the limitations. A correct disclaimer is enough to do it.
Cheers,
Kris of Frankens Team
Excel’s built-in chart types and formats leave much to be desired. What makes Excel powerful is that everyone has it and uses it (sometimes begrudgingly), and that the original developers of Excel built in a lot of flexibility. It is creativity and flexibility within these constraints that has made my career and enhanced many other careers.
I’d be careful with that haute-couture comparison, as eye-catching as it is. I’m not sure you want to be considered expensive and elitist and serving no practical purpose 😉
Hui –
1. I’d still consider climate change more emotional than chart types, despite the immense body of evidence supporting it. But the comments of this article are now at least as long as the article itself.
2. It is important to try different ways to present information. It is also important to judge them as objectively as possible, and to learn the strengths and weaknesses of the new types compared to those of the old types. Personally I find most of the Franken examples to be potentially confusing (especially the curved bar charts and the pie charts with irregular outlines), but less so than the chartoids found in USA Today. And it’s worthwhile to consider these variations, if only to help reinforce what makes the old standby charts so effective.
Maybe I seem grouchy when I’m commenting on attempts like this, but then, how can I be a grouchy old man if I can’t be grouchy?
You are right on 1.
And I am with you on 2. We should push new ideas and new ways of doing things. Sometimes we may produce something truly awful (and have people call you Elvis of Speedo charts), but that is the only way to learn. No one every became awesome by just observing the rules.
I am glad to see so much of animated discussion on the merits of a spoke chart. But I would be equally joyous to know if people learned the trigonometry & technique we used here and apply it elsewhere in life.
I finally submitted the chart to the big boss and he LOVED it. Exactly what he wanted. He already has other regions and divisions interested in using it. I can’t paste a picture in here otherwise I would show you what the end result looked like. It actually looks pretty good!
It’s good that he’s happy.
But here’s the thing: he’s pushing a chart that uses techniques that have been proven to be cognitively inferior to much simpler, tried and true alternatives. Much of that proof is summed up in books such as Colin Ware’s Information Visualization, or Edward Tufte’s works, or Stephen Few’s books.
But hey, he’s the boss.
Case in point: here’s a graph that the OECD published recently:
http://screencast.com/t/HFxK6Qodh
I saw a dashboard put past one of the bosses where I worked recently that was far worse than even this. That boss loved it. Go figure.
The boss is happy, so all the cog sci be damned. It looks good, who cares if it’s not readable.
But that OECD chart is ridiculous. It’s a caricature of all the bad charts out there. I can’t really imaging any boss liking it. At worst, the boss would want all pyramids.
Jeff, do you have a reference for the OECD chart? It would be great for getting a laugh in a presentation, but I like to have an exact link for the source.
http://www.oecd.org/dataoecd/2/37/47228941.pdf
It’s a big document, so may take a couple of minutes to appear in your browser
page 118 (PDF page 120) has a line chart where the markers on one are a completely different color that the line color, which makes it pretty hard on the eye
page 119 has a rediculous 3d graph that uses white, black, and dark purple to color the series against a background that graduates in color from blue to purple and then back to blue
Page 128 has much the same
Page 139 has three pie charts, two of which have a 3d-ish rendering (but fortunately are shown from direct above
Page 181 is the graph I initially sent. it plots some data as zero when it is in fact not avaliable (i.e. should be left off the graph entirely)
Page 110 has a good bar graph, showing they aren’t beyond producing one!
Good for you. I’ll probably never use this, but it helps us all to consider possiblilities, and maybe one day we’ll use something we’ve learned for something else. What’s the harm?
dont need to be so complicated, you can just use a radar chart. btw, I am with Jon, this is not a good chart type.
This is probably the ugliest chart I have seen to date, very hard to read, a simple line would have done trick I think.
Hi ,
I am wondering if a scatter diagram is possible without graphs. I mean coloring cells as per x y location.
Rakesh: Perhaps you are thinking of a heat map?
Thanks for the reply n Suggestion Jon. I want to plot their Z Score within [User Choice] Std dev to see the extra ordinary performer. With scatter diagram it very slow. Heat map is an good idea.
Thanks
Thanks for the reply n Suggestion Jon. I want to plot their Z Score within [User Choice] Std dev to see the extra ordinary performer. With scatter diagram it very slow. Heat map is an good idea.
Thanks 🙂
About your spoke chart, and pardon me if I did not read all the comments, as this could have been brought up already: I needed a spoke chart to show a “vulnerability index” of various instruments at a moment – a snapshot. It would always have the same items over time, only their values would change; and since, for this comparison a smaller index value = better, the spoke approach would highlight the bad actors. I looked at your code and decided to get clever.
My data set is essentially very simple after it has been culled and massaged. Example:
A 0.25
B 0.4
C 0.12
D 0.76
E 0.34
F 0.38
G 0.28
H 0.37
J 0.12
I took these data and transformed these into a orthogonal matrix like so:
A B C D E F G H J
A 0.25 0 0 0 0 0 0 0 0
B 0 0.4 0 0 0 0 0 0 0
C 0 0 0.12 0 0 0 0 0 0
D 0 0 0 0.76 0 0 0 0 0
E 0 0 0 0 0.34 0 0 0 0
F 0 0 0 0 0 0.38 0 0 0
G 0 0 0 0 0 0 0.28 0 0
H 0 0 0 0 0 0 0 0.37 0
J 0 0 0 0 0 0 0 0 0.12
– and then I made it directly into a radar chart. This approach directly made an equi-angle spoke chart without fuss. Five minutes.
If I get a chance to play with this (translation: when it’s been asked for five more times) I will code it to make the matrix automatically and to make the legend labels and the lines match in color automatically.
I hope you like this, and cheers.
Hi All,
First of all, @Chandoo, can’t thank you enough for your great website. I learned a lot from it! (and there is still a lot for me too learn :)) Hope I can contribute something in the future, but first I need to get better before being able to contribute.
In the past I remember I have downloaded the Excel file for this pricing scheme:
http://chandoo.org/wp/excel-school/
(the green table below)
Does anybody know where I can find the download URL for this pricing scheme in Chandoo’s website?
Thank you in advance for it the help.
The spider chart helped me to make a polar plot for plotting vectors for the purpose of field balancing. Thanks a lot
is there a way to get 4 circles?
@Clau_0808
You can add any number of circles you want
The Circles consist of 3 Named Formula
So add 3 Named Ranges
X_4: =COS(t)*Circle4
Y_4: =SIN(t)*Circle4
Circle4: =’1′!$C$25 or a Value of the circles radius
Then select the chart
Right Click and Select Data
Add
Series_Name: Circle 4
X_Values: =’1′!X_4
Y_Values: =’1′!Y_4
Format the new circle to suit
Refer: http://chandoo.org/wp/wp-content/uploads/2012/07/Spoke-Chart2.xlsx
Dear Sir,
while adding Circular Grid Lines its not accepting series Y value. Pl help
@Arun
Circular Grid lines must be added as a new series using either a Range or a Named Formula to hold the values
Can you post the file or email it to me
Hui…
Trying to add the circle to the spoke chart but getting a invalid reference warning when I use the ‘spreadsheetname’!x_1 as x and ‘spreadsheetname’!Y_1 for the y. I have added the named ranges as the sin and cos. It worked for a bit but then began saying that there was an invalid reference.
Great work though. I have been trying to get an astrological chart for excel and this works great. Have all the points on the chart…just cant get the “adding as a series” part for the circles to work.
Thanks
Lorrie
Hi Hui and Chandoo,
Thank you both for the time and effort to show us non-experts, what excel can do.
I was amazed by your Spoke chart. Great work.
@Mahir
Thankyou for the kind feedback
I hope you had a look at: http://chandoo.org/wp/2011/07/06/3d-dancing-pendulums/
and
http://chandoo.org/wp/2012/02/21/formula-forensics-013-on-vacation/
You’re welcome.
I will do so. There are so many things to learn.
What logic is followed when the size of circles is calculated
@Zulqarnain
This is covered in the Add Circular Grid Lines section of the post
But in summary I use a Named Formula t to hold an array of Radians for each 1 degree from 1 to 361
Then calculate the X and Y values using named formula for each Circle using a simple =Radius x Sin(t) formula
Then add the X & Y to the chart as a new series
Thanks for the reply. Please explain the following formula logically. How does it suit here to calculate the figure “15”.
=5*(INT(MAX(C4:C19)/5)+1)
I mean why the maximum value is is divided by 5, then 1 is added in the calculated rounded off figure and finally multiplied by 5. I am not getting it. Please explain its logical connection with the chart.
@Zulqarnain
This formula works out the maximum grid line size
It takes the maximum value of the range C4:C19
divides it by 5 and takes the integer of that
eg say the max value was 19, it will return Int(Max(19)/5) = 3
It then adds 1 = 4
and Multiples it by 5 to get 20
Which is the next grid line size based on 5 past 19
thanks for the response.
I am confused about the division and multiplication by 5. we have 6 lengths i.e. 5,6,1,10,11,13
why don’t we divide and multiply the greatest number(13) with 6.
Please tell me which mathematical logic is used, so that I may first understand the basic mathematical principle and then try to figure something out.
Thanks in advance.
I am having problems with this step:
“In a blank cell C29 type: =COS(t)*Max_Circle press F9 not Enter
Excel will display ={14.9977154273459;14.9908624052864;14.9794430213186; … 14.9908624052864;14.9977154273459;15;14.9977154273459}”
Evan i am presing F9, excel is desplaing only 1 value: 14.9977154273459
i have evan renamed the sheet “1”.
Thanks in Advance
@Ismail
Did you use the sample file supplied?
It contains the Named Formula t and Max_Circle which are required for the above to work
That is great that so many have suggested the limitations of and alternatives to the spoke chart. I actually need to graph/depict geometric angles out of 360 degrees to represent… literal angles out of 360 degrees, so this tutorial is a life saver!
“If a chart is effective or not, that’s what’s important.” Well said, under the circumstances that the eye of the reader will decide that.
Thx Hui, for your work, that encourage me, to (re) consider what is known under the name of bulls eye chart. That one, is more appropriate for my (financial) reports. It help me to track, when a KPI, reach zero point. Many thanks, to all of you, which share youre experience, ideas.
How can we create the below kind of chart in Excel without using GIGRAPH.
https://appsource.microsoft.com/en-us/product/office/WA104379873?src=office&corrid=052877d3-e530-48ff-83f6-3b83cb78bb0b&omexanonuid=3eb7b2ed-019a-439a-8f59-e96f68a80f8a
@Prabu
What is wrong with downloading it?
There is no existing way unless you make them manually