
This article is part of our VBA Crash Course. Please read the rest of the articles in this series by clicking below links.

- What is VBA & Writing your First VBA Macro in Excel
- Understanding Variables, Conditions & Loops in VBA
- Using Cells, Ranges & Other Objects in your Macros
- Putting it all together – Your First VBA Application using Excel
- My Top 10 Tips for Mastering VBA & Excel Macros
In the part 5 of our VBA Crash Course, let me share you my tips for mastering Excel VBA.
A warning before jumping in to the tips: I am not a VBA expert. I am a learner, just like you. I find VBA quite interesting language to learn and explore. These tips are based on what I have learned writing VBA (and VB code) in the last 12 years.
Tips for using & mastering VBA in short term:
#1 Think Thru before Coding
The best way to solve even a very complex problem is to think thru. Next time, when you are about to automate that report or clean some imported data using VBA, just write the logic down on a paper. See and understand various aspects of the problem. The solution becomes clear to you. It has worked for me and it works for you too.
Related: Building your First VBA Application using Excel
#2 Use the Recorder
Excel’s built in Macro recorder is a great way to learn about new objects and ways to deal with them. I use it all the time to record parts of my code and then customize the output. Just keep in mind that macro recorder does not produce the best or complete code all the time. But it gives you a damn good idea about how to write code for a set of actions.
Related: Introduction to Excel VBA & Writing your First Macro
#3 Use Immediate Window
Excel VBE has a powerful feature called as Immediate window. Think of this like a sandbox. You can write almost any VBA statements here and get quick results. For example, Open VBE (ALT+F11 in Excel) and go to Immediate window.
- Type ?Activecell.Value
- Press Enter
- And you will see the current cell’s value printed in immediate window
Here is a quick demo of immediate window.
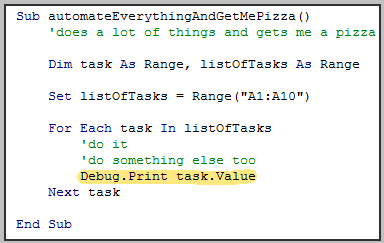
#4 Debug.Print is your Friend
There are 3 things you cannot avoid in life
- your 2 year old daughter thinking it would be fun to throw a stone on your car
- your baby boy running and sitting in your lap suddenly making the hot coffee spill on you
- and of course bugs in your code
Bug is a fancy name given to the situation when your code is not doing what it is supposed to do.
But why?!? Well, we don’t know why unless we examine. And this is where Debug.Print can come handy. In below example, you would see the values of all tasks in the immediate window as your program runs.
#5 There is a method for that!
Just like Apple says There is an App for that!, may be Microsoft should say There is a Method for that! about VBA. I say this because VBA comes with a lot of methods and functions to do lots of things. If you are thinking of writing your own code to reverse some text, split something based on a delimiter, find the intersection of 2 ranges or run something after 10 seconds, may be you should before writing your code. Because, my dear, there is a method for that.
Whenever you feel like you are writing code for a problem that is already solved several times, chances are there is some built-in method or object for that. So just search.
Tips for Using & Mastering VBA in Long-term
While the above tips are good for solving your immediate problems, we should always aim for continuous improvement. Here are my top tips for keeping your VBA in shape.
#6 Break Your Work in to Smaller Chunks
No matter how complex your work situation or problem might be, chances are, it is made up of several smaller problems. So break things in to smaller chunks. This coding technique is called as modularization. Modularization has several advantages:
- Reuse: Once you break a big program to smaller parts, you can reuse a smaller part in several places or in other projects.
- Testable: Smaller code fragments are easy to test and debug.
- Maintainable: You can maintain smaller parts easily. You can upgrade them once you get a better version of Excel without breaking much.
#7 Build Iteratively
Rome is not built in one day, so is your buildRome() macro. Whenever you are attempting to automate a whole department’s work, take a step back and see what is the smallest (but most useful) feature you can have. Implement it and then add new features iteratively. That way, your turn-around time is improved, you look pretty in front of your boss and you feel in control of things.
Iterative development also lets you stop whenever you want and you would still have some working piece of code.
#8 Keep a Good Reference Handy
If you are going to use VBA quite often, then invest in a good reference. I suggest John Walkenbach’s Excel 2010 Power Programming if you are looking for one. Good reference books have lots of information and tips buried in them. For example, I keep Excel 2010 Power Programming book on my desk all the time and refer to it whenever I feel like not doing any work. I always learn something new.
#9 Take up Challenges
“Computers are like bicycles for our mind” said Steve Jobs. I am not sure if hours I put on facebook, twitter and gmail are keeping my mind fit. But any time I invest on programming is worth every second. I feel very sharp, excited and stoked when I solve a tricky problem using a computer program (be it VBA, an Excel Formula or php or anything else).
I think if you want to be good in VBA or Excel, then take up challenging work. Try to automate a report that you (or your team) produce using VBA, Try to simplify a formula or improve a chart.
If you are looking for fresh challenges, then look at our forums. We get dozens of interesting questions everyday.
#10 Use VBA only when you need it
Once you start learning VBA, it is natural to feel excited about the possibilities you have. But keep in mind that overusing it can complicate your work.
My suggestion: Use Excel’s native features as much as possible. Excel has several built in features to solve various day to day problems (conditional formatting, pivot tables, formulas, data validation, form controls to name a few). Only when you feel that there is no easy way to use Excel alone to solve a problem, go for VBA.
Example: Recently, I showed you all how to split text on new line using VBA. I did that because I thought there was no way to do it using Excel’s built in text-to-columns utility. Well, I was wrong. As Debra proved in the comments,
Chandoo, if you want to do this in the Text To Columns dialog box,
Select Delimited, then check “Other”
In the box beside Other, press the Alt key, and type (using the number keypad): 0010That should separate the text on the line break character.
So if you feel like there is no way to do something in Excel without resorting to VBA, well, just keep looking, because there might be a way.
What are your Tips for Learning & Mastering VBA?
Its your turn now. What are your top tips for mastering VBA? Please share using comments because I and many of our readers want to learn. Go ahead and post.
Join Our VBA Classes
We run an online VBA (Macros) Class to make you awesome. This class offers 20+ hours of video content on all aspects of VBA – right from basics to advanced stuff. You can watch the lessons anytime and learn at your own pace. Each lesson offers a download workbook with sample code. If you are interested to learn VBA and become a master in it, please consider joining this course.
Click here to learn more and Join our VBA program.
Thanks
This post concludes our series on VBA Crash Course. I hope you enjoyed these 5 articles and learned something new. I really enjoyed writing this series. Thank you so much for your comments and support.
For more about VBA & Macros, consider enrolling in our online course.


29 Responses to “My Top 10 Tips for Mastering VBA & Excel Macros [Part 5 of 5 – VBA Crash Course]”
[...] My Top 10 Tips for Mastering VBA & Excel Macros [...]
Thank you so much Chandoo.. Your VBA crash course is very informative for me. I have joined in a new project in my company where all work is done in VBA. I am very happy with your tips and all examples. Now i am going to start your Online VBA classes. Hope that will give me more help. Even i have downloaded the John Walkenbech's book as per your suggestion.
Excellent Tips for the beginners. Excel Beginners who just started learning VBA can apply these tips in their project which will help them in solving their problems.
Most insightful short course which has really helped. The biggest learning has been the immediate window... as I'm always debugging my scripts.... the disadvantage of being dyslexic!
Many thanks
I found the book "Professional Excel Development" by Rob Bovey, Dennis Wallentin, Stephen Bullen, and John Green to be indispensable in learning how to properly program and work with Excel. It's not a reference book, it's a what is possible and how to go about setting Excel up properly for different applications. Quite incredible. This is one for people who really want to get into programming/creating Excel apps.
If you find yourself using debug.print a lot, consider using the watch window.
Instead of using
debug.print task.Value
just select task.Value in the code, then right-click and choose Add Watch from the context menu, and select Beak When Value Changes as the watch type.
Some excellent tips as always Chandoo.
In section 6 "breaking the code into smaller chunks" an added advantage is that Modularization makes the code much easier for someone else to understand and audit.
I would add that you should add comments within your code so that you and others can understand the purpose of each section/module .
Hello,
Nice tips to become a smart programmer, i am very happy you had start learning and teaching to all the power of Excel VBA.
When i visit the blog first time i was thing if Mr. Changoo start working VBA then that will be awesome because after checking the tips and tweaks in the blog it seams your teaching them what Excel can do not what we can do in excel.
I am from Pakistan, the corporate training in School of Business Analysis. (Topic We Cover: Business Excel (Advance Excel with Professional Life Tips) , Mystery of Dashboard, Cross the Excel Limilts (VBA), Application Development (Excel VBA + Word & VB6 + Crystal Report, Access), Business Automation (Word, Excel, Power Point, Outlook, Publisher), HTML5/ CSS3, JAVA, PHP, ORACLE and MANY MORE
[...] My Top 10 Tips for Mastering VBA & Excel Macros [...]
Thank you so much for such a great crash course.
There's one more very important thing when writing any code (I am a big fan of VBA but I work with other languages, too). Use comments! Comment your code so that when you have to work with it six months (or years) later, you won't need to rediscover the wheel...
Everything is simple … once you know it. Very thoughtful and considerate tips, thank you.
I really liked crash crouse and want to learn and master in this. thank you very much!. I really don't have any technical knowledge. really your site is very helpful and currently the work is all in excel 2003. I know still, I am trying to put what I learn from this crash courses.
these are great, and I tried the debug.print in the immediate window and the immediate window was just blank. my excel print formatting macro just isnt working 🙁 I have made this macro several times before on a different computer and recorded it all the times I've made it and it worked just fine. How do I figure out what I'm doing wrong?
Sub PrintFormatting()
'
' PrintFormatting Macro
'
' Keyboard Shortcut: Ctrl+Shift+P
'
Application.PrintCommunication = False
With ActiveSheet.PageSetup
.PrintTitleRows = "$1048570:$1048570"
.PrintTitleColumns = ""
End With
Application.PrintCommunication = True
ActiveSheet.PageSetup.PrintArea = ""
Application.PrintCommunication = False
With ActiveSheet.PageSetup
.LeftHeader = ""
.CenterHeader = "&""Arial,Bold""&14&F" & Chr(10) & "&A"
.RightHeader = ""
.LeftFooter = "E.Byrne | &Z&F"
.CenterFooter = ""
.RightFooter = "&P of &N"
.LeftMargin = Application.InchesToPoints(0.2)
.RightMargin = Application.InchesToPoints(0.2)
.TopMargin = Application.InchesToPoints(0.75)
.BottomMargin = Application.InchesToPoints(0.75)
.HeaderMargin = Application.InchesToPoints(0.3)
.FooterMargin = Application.InchesToPoints(0.3)
.PrintHeadings = False
.PrintGridlines = True
.PrintComments = xlPrintNoComments
.PrintQuality = 600
.CenterHorizontally = True
.CenterVertically = False
.Orientation = xlLandscape
.Draft = False
.PaperSize = xlPaperLetter
.FirstPageNumber = xlAutomatic
.Order = xlDownThenOver
.BlackAndWhite = False
.Zoom = False
.FitToPagesWide = 1
.FitToPagesTall = False
.PrintErrors = xlPrintErrorsDisplayed
.OddAndEvenPagesHeaderFooter = False
.DifferentFirstPageHeaderFooter = False
.ScaleWithDocHeaderFooter = True
.AlignMarginsHeaderFooter = True
.EvenPage.LeftHeader.Text = ""
.EvenPage.CenterHeader.Text = ""
.EvenPage.RightHeader.Text = ""
.EvenPage.LeftFooter.Text = ""
.EvenPage.CenterFooter.Text = ""
.EvenPage.RightFooter.Text = ""
.FirstPage.LeftHeader.Text = ""
.FirstPage.CenterHeader.Text = ""
.FirstPage.RightHeader.Text = ""
.FirstPage.LeftFooter.Text = ""
.FirstPage.CenterFooter.Text = ""
.FirstPage.RightFooter.Text = ""
End With
Application.PrintCommunication = True
End Sub
THANK U SO MUCH FOR WEBSITE. I HAVE LEARNT SO MUCH. I AM NEW TO EXCEL MACROS. I WROTE A MACROS AND THE CHALLENGE IS I WANT IT TO WORK FOR ONLY ONE YEAR (12 MONTHS) PERIOD AFTER WHICH I WANT IT TO STOP WORKING. HOW DO I GO ABOUT INSERTING THE NECESSARY CODES TO MAKE THIS HAPPEN
Hi Eddy
I am started working on VBA just now. i am working on project which generates SQL Query based on user input.
can you please help me on this
I love this site, and in combination with some others I can have alot of fun with excel (I took VBA in school, great mark, still hated it).
Betsy: I think you'd have better luck putting that onto the forums, more people are likely to spot it there. I'll take a peek into it tonight at any rate.
Eddy: Odd thought for that: Did you know that you can make a date return a value? So in that case, for a very basic solution, you could find the Value for the day you want it to stop working, and hide a cell containing that value for example. Then, if today > end date, toss in whatever code you're after
using immediate window is a good help and a time saving tool. good post!
Chandoo.org is an awesome blog and a good help for all!!...With such an easy examples you have made it so easy to understand the VBA programming!!...
I am looking to create a recipes costing, what are the best tools to use to create a Master Ingredients sheet with a drop down list?
I have set range for row but column which i would like to merger through input box.
Could you please help me in below code?
Sub Merge_test()
Dim MYC, MYCC, MYCCC As Variant
ENTERROW:
StartRow = Trim(InputBox("Enter Start Row No."))
If StartRow < 2 Then StartRow = 2
If StrPtr(StartRow) = 0 Then
MsgBox "Invalid Row No."
Exit Sub
Else
If StartRow "" Then
If IsNumeric(StartRow) = False Then
MsgBox "Please Enter Numeric Row Number"
GoTo ENTERROW:
End If
Else
MsgBox "Please Enter Row Number"
GoTo ENTERROW:
End If
End If
EndRow = Trim(InputBox("Enter End Row No."))
If EndRow "" Then
If IsNumeric(EndRow) = False Then
MsgBox "Please Enter Numeric EndRow Number"
GoTo ENTERROW:
End If
Else
MsgBox "Please Enter EndRow Number"
GoTo ENTERROW:
End If
For r = StartRow To EndRow
'New Code'
MYC = Trim(InputBox("Output Column in Number"))
MYC = Range(MYC)
MYCC = Trim(InputBox("Input Column 1"))
'Range("B1").Value = MYCC
MYCCC = Trim(InputBox("Input Column 2"))
'Range("C1").Value = MYCCC
'C = Range("A1").Value
'CC = Range("B1").Value
'CCC = Range("C1").Value
Cells(r, MYC) = Cells(r, MYCC) & "_" & Cells(r, MYCCC)
Next
End
End Sub
Dear Sir,
Please send me your valuable vba post
Thanks
Hi
Can we insert object or image as processing icon at only micro is in process. Please suggest
Thanks for the crash course!
Thanks for great tips!!!!
Can you please tell if there is a way to trigger an event on change of cell value, i really need help with it?
@Vidushi
Yes, You can use the Worksheet_Change event
Refer:
https://msdn.microsoft.com/en-us/library/office/ff839775.aspx
or
http://stackoverflow.com/questions/18500608/vba-trigger-macro-on-cell-value-change
[…] http://chandoo.org/wp/2011/09/06/top-10-tips-for-excel-vba/ […]
Dear Sir
how to amend the below code to "Stationery."Text1 to append one time when the VBA code is run twice?
Sub AppendToExistingOnLeft()
Dim c As Range
For Each c In Selection
If c.Value "" Then c.Value = "Stationery." & c.Value
Next
End Sub
I appreciate your step-by-step approach. Your explanation makes this material accessible for a wide audience. Keep up the great contributions.