Pricing Tier Lookup formula
Here is an interesting twist on the good old VLOOKUP. How to find the pricing applicable for given quantity of a product?
Something like above.
Looks interesting? Then read on…
Formula Forensics No. 038 – Find Which Worksheet a Max or Min Value is located on
Learn how to find which worksheet a max or min value occurs on using this neat formula
Case Sensitive Lookups
We all know that VLOOKUP (and its cousins MATCH, HLOOKUP and LOOKUP) are great for finding information you want. But they are helpless when you want to do a case-sensitive lookup.
So how do we write case sensitive VLOOKUP formulas?
Simple. We can use EXACT formula.
Who is the most consistent seller? [BYOD]
Who is the most consistent of all?
Imagine you are a category manager at a large e-commerce company. Your site offers various products, but you don’t really make these products. You list products made by other vendors on your site. Every day, these vendors would send you invoices for the amount of product they have sold. Above is a snapshot of such invoices.
Looking at this list, you have a few questions.
- Who is the best seller?
- Who is the most active seller?
- Who is the most consistent seller?
- Which seller has fewest invoices?
Let’s go ahead and answer these using Excel. Shall we?
Export iPhone contacts to Excel using this free template
Recently my iPhone 4 crashed. It is 3.5 years old. And just like any other 3 year old, it started acting weird & crazy one night. The next morning it went silent. It won’t go beyond the Apple logo whenever I start it. Since I couldn’t wait for the phone to start, I took out the SIM card (the phone is unlocked, if you are wondering) and placed it in my old Nokia phone. But alas, none of my contacts are on the SIM. They are in “cloud”.
After a day of answering phone calls from everyone including my mom as “Chandoo here”, I’ve decided to get my contacts back. So I logged in to iCloud to download a backup. And the backup was a .VCF file.
Since I wanted to have all my contact numbers in a spreadsheet, I did what any Excel nerd would do. I built a template that can convert VCF data to Excel worksheet.
The ultimate VLOOKUP trick – Multi-condition Lookup
This is a guest post by Sohail Anwar.
Let’s not bore you with an intro. You are about to learn a VLOOKUP trick that Lucifer himself would not want you to know. It’s so absurdly powerful that it was developed in a lab and had to be tested on Rocky’s arch nemesis Ivan Drago.
Presenting the Multiple criteria VLOOKUP!
…boring…pass, we’ve seen it.
Oh, have you? Not like this you haven’t. This will change the way you work with Excel.
Let me start with an easy example. Here’s some data and we would love to know what Bb and Dd is.
A better chart to visualize “Best places to live” – Top 100 cities comparison Excel chart
Recently, I saw this chart on Economist website.
It is trying to depict how various cities rank on livability index and how they compare to previous ranking (2014 vs 2009).
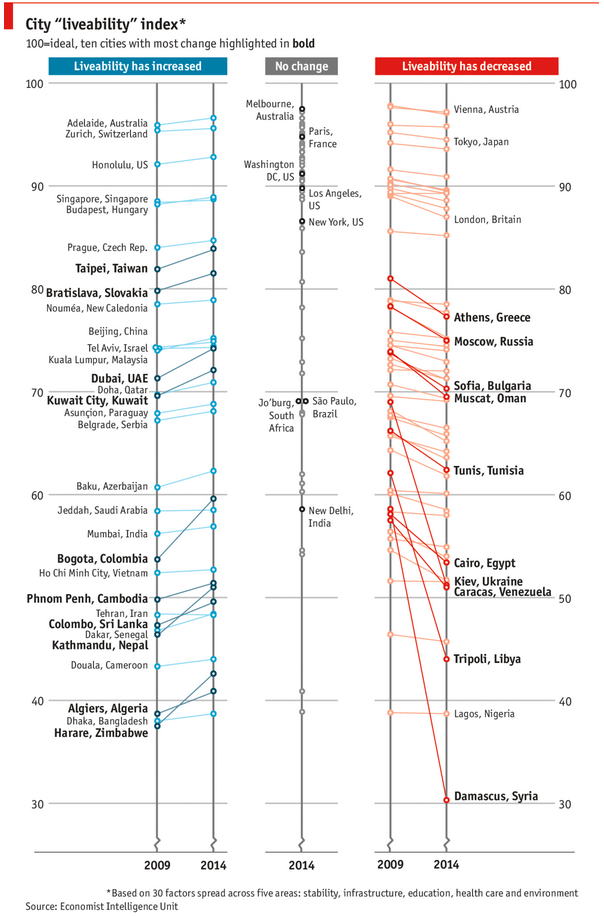
As you can see, this chart is not the best way to visualize “Best places to live”.
Few reasons why,
- The segregated views (blue, gray & red) make it hard to look for a specific city or region
- The zig-zag lines look good, but incredibly hard to understand % changes (or absolute changes)
- Labels are all over the place, thus making data interpretation hard.
- Some points have no labels (or ambiguous labels) leading to further confusion.
After examining the chart long & hard, I got thinking.
Its no fun criticizing someones work. Creating a better chart from this data, now thats awesome.