
This week I have asked a number of owners of notable Non-MVP Excel websites for their input to their favorite Excel Tips, Tricks, Cheats & Hacks.
Notable means that the web site has attracted my attention and made it into my list of Excel Shortcuts in my Firefox browser.
Lets dive in:
001. Percent of True Items in a Pivot Table Field – Doug Glancy
Doug presents a post on how to add a Percentage of True Items in a Pivot Table
You can read the description at Doug’s YourSumbuddy Website
Contribution by: Doug Glancy
Website: YourSumbuddy
002. Fixing Bad Dates – MF Wong (aka Fung)
I regularly encounter dates that have been incorrectly input in Excel. To a regular Excel user, it is really a terrible experience.
Therefore I wrote a post about fixing trouble dates:
https://wmfexcel.com/2014/10/12/fixing-trouble-dates/
Using Text to Columns #4 in the post is my favourite trick to fix this kind of problem
Contribution by: MF Wong (aka Fung)
Website: wmfexcel
003. Using wildcard to reference sheets in formula bar – MF Wong (aka Fung)
Using wildcard to reference sheets in formula bar – a very well hidden magic
This trick, although is not perfect (not dynamic), but is incredibly useful for those who do 3D sum frequently.
https://wmfexcel.com/2015/07/11/sumc3-is-it-a-valid-formula-no-it-is-magical-indeed/
Contribution by: MF Wong (aka Fung)
Website: wmfexcel
004. Convert PDF to Excel without PDF converter – MF Wong (aka Fung)
Well technically this is not an Excel trick. Nevertheless I find it super relevant in workplace, but not yet commonly discussed on Internet.
https://wmfexcel.com/2015/08/08/convert-pdf-to-excel-without-pdf-converter/
Contribution by: MF Wong (aka Fung)
Website: wmfexcel
005. Conditional Standard Deviation – Andrew Engwirda
Excel does not have a Conditional Standard Deviation, ie: a STDEVIF() function. It’s got other conditional functions like COUNTIF(S), SUMIF(S) and AVERAGEIF(S), but is somewhat lacking when it comes to calculating conditional standard deviation.
I have written a user defined function that adds the functionality of a Stdevif() function.
You can read about it here: http://andrewexcel.blogspot.
Contribution by: Andrew Engwirda
Website: Andrews Excel Tips
006. Text Troubles – Andrew Engwirda
If you work with data from various sources, it’s possible you will come across numbers formatted as Text. Depending on what you plan to do with these numbers, it’s possible that the Text formatting will cause problems.
This post explores how to anlayse and fix some of these issues:
http://andrewexcel.blogspot.
Contribution by: Andrew Engwirda
Website: Andrews Excel Tips
007. VBA Code Indenter – Andrew Engwirda
http://andrewexcel.blogspot.
Contribution by: Andrew Engwirda
Website: Andrews Excel Tips
008. Indenting Code in Cells – Andrew Engwirda
There’s a few addins out there to indent VBA code. I should know this because I made one of them.
But let’s say for argument’s sake that you can’t use any of them. Perhaps you’re using a computer somewhere that won’t allow you to install what you want. You still have access to the VBE, right?
You can do the work in cells on a worksheet, then transfer the results to the VBE
Read about the technique here:
http://andrewexcel.blogspot.
Contribution by: Andrew Engwirda
Website: Andrews Excel Tips
009. Advanced Find & Replace – Andrew Engwirda
Excel’s built-in Find / Find and Replace dialog box is quite useful. Unfortunately you can only find/replace one thing at a time.
(This doesn’t mean you can’t select all cells with the same value at the same time. Just use the Find All button, select one of the results and click Ctrl+A on your keyboard at the same time to select all cells with the same value. The thing is you can only “find” one thing at a time).
Anyway, recently I’ve had to find/replace in lots of cells in various worksheets, and doing the same thing over and over again led me to say “Oh dear, what a bother!”. (Well, perhaps I used stronger language than that)
So I made this.
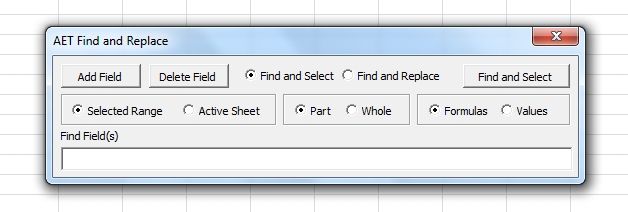
http://andrewexcel.blogspot.
Contribution by: Andrew Engwirda
Website: Andrews Excel Tips
010. Setup perfect square gridlines in Charts – Frankens Team
This technique combines XY Scatter with Pie charts to have perfect square gridlines.
Perfect square plot area, perfect square gridlines

I haven’t seen this trick published elsewhere, but I really like it because of the simplicity. We used in lot of other chart solutions where the perfect square plot area was key element.
Contribution by: Frankens Team
Website: E90E50
011. Change the Value Fields in Pivot tables using a Slicer – Frankens Team
This technique makes it easier to change the value fields in Pivot tables or Power Pivot using only a special slicer and few rows of VBA.
Use Slicer to select value fields for Pivot table or PowerPivot!

This trick helps my users to easily select the measure they want to analyze in their pivot table.
Contribution by: Frankens Team
Website: E90E50
012. Combine a hyperlink and drop down list – Frankens Team
It is very easy to use a hyperlink to navigate within a workbook.
But if you have lot of worksheets, it may be easier to combine hyperlink and drop down list.
In this post we will show you how easily you can set up this feature!
The trick is in the order of steps.

Hyperlink to a dynamic range – easy navigation
Contribution by: Frankens Team
Website: E90E50
013. Add a % calculated measure without generating blank rows in Pivot tables – Frankens Team
This last technique can be interesting for some PowerPivot users.
It’s a trick how to build up % calculated measures without generating blank rows in the Pivot table.
Solution: avoid using constant value in fraction calculations.

PowerPivot: Constant in calculated field results blank rows
I had not found solution in google. So I started to investigate and found the root of the problem…
Contribution by: Frankens Team
Website: E90E50
014. Calendar Control for all Office Versions inc. Mac – Frankens Team
Contribution by: Frankens Team
Website: E90E50
015. Combine Bubble and xy scatter line chart – Frankens Team
Have you ever wanted to connect the bubbles of a bubble chart with lines?
For example to create kind of a timeline: how the position of a product changes month by month in a Growth/Profit matrix.
You would like to see something like this:

The technique to achieve this is discussed here:
https://sites.google.com/site/e90e50fx/home/combine-bubble-and-xy-scatter-line-chart
Contribution by: Frankens Team
Website: E90E50
016. Useful Worksheet properties in VBA – Paul Kelly

Contribution by: Paul Kelly
Website: ExcelMacroMastery
017. Remove blank rows using special cells – Christos Samaras
Remove blank rows using special cells


Contribution by: Christos Samaras
Website: My Engineering World
018. Using SUMPRODUCT function for numerical integration – Christos Samaras
Contribution by: Christos Samaras
Website: My Engineering World
019. Common auxiliary VBA functions that I use in my projects – Christos Samaras
I use a number of Auxillary Functions to assist me in my Excel and VBA Development
These functions include:
– SheetNameExists
– GetFileNameFromPathNoExtension
– FileExists
– NamedRangeExists
– IsUserFormLoaded
– GetIndexOfArray
– HasBadCharacters
These VBA functions are all demonstrated in the mFunctions Code Module in VBA in the sample file
You can see them all in the attached file: Download Sample File
Contribution by: Christos Samaras
Website: My Engineering World
020. Get data from Tables with VLookup – Christos Samaras
I use VLOOKUP with COLUMN() function and $ symbol for getting data from tables with multiple columns (sometimes exceeding 100 columns).
I have attached a sample, in which you can see what it is:
– A classic VLOOKUP formula;
– In which the $ symbol is used for locking the lookup value (its column actually is locked);
– Instead of column index, the volatile function COLUMN is used;
– This simply requires the Report worksheet columns to contain the same data layout as the Data Source worksheet
Download Sample File
Contribution by: Christos Samaras
Website: My Engineering World
021. Create a QueryTable from an SQL Query – Tom Kacprowicz
This technique creates a QueryTable from an SQL Query (so called MS Query) within your current Excel Workbook. Normally you need to undergo a lengthy 7 step process.
What does it do?
It creates a QueryTable from an SQL Query (so called MS Query) within your current Excel Workbook. Normally you need to undergo a lengthy 7 step process.

4. I recommend adding an Excel Shortcut (Macro Options) or adding it to your Excel Quick Access Toolbar.

4. Provide your Query and Click Ok.
Why I find it a Great Excel/VBA Tip
In just a couple of seconds you can run a SQL SELECT Query on your Data. In case of errors you will see the error message.
However with MS Queries you can build quick recipes for complex data analysis or quick data transformations.
How would you list a distinct list of records from an Excel Table?
Without MS Queries that would be hard (a Pivot Table? An Array Formula? A VBA Macro?), using MS Query it takes 10 seconds (see first example in my Excel file). MS Queries (SELECT) allow grouping, filtering, ordering, distinct.. the list goes on.
You can see how this works in the short video below:
Contribution by: Tom Kacprowicz
Website: The Analyst Cave
Closing
A very special thank-you to the Contributors who contributed to the Excel Tips, Tricks, Cheats & Hacks shown above.
The quality of the posts demonstrates the contributors skill and passion to the use of Excel & VBA.
I hope you get to to revue all the tips and pass comments and appreciation back to the authors as appropriate.
Next week will be the second last post in the Excel Tips, Tricks, Cheats & Hacks series, where I will be asking you for your contributions.
These will be combined with the existing comments from this and the previous 2 posts to make the final final post: Excel Tips, Tricks, Cheats & Hacks – Readers Edition.
As always if you have any Excel Tips, Tricks, Cheats & Hacks you would like to share with us please do so in the comments below:


11 Responses
Ciao Hui,
Collecting Excel tricks under the title “Notable Excel Websites (Non-MVP) Edition” is a brilliant idea…
Thank you in the name of all The FrankensTeam.
On our site there is a box with a picture and text highlighting:
This is a no-MVP site
we think ourselves “bad boys” a bit 🙂
For those who would like to know why our site is a no-MVP site, enough to click on the link:
http://goo.gl/lxDszY
Thank you again!
Thanks a lot
I really enjoyed this (newsletter). I must admit that I rarely read an Excel newsletter (and I subscribe to quite a few) all the way though, but this grabbed my attention and before I realized it, I was engrossed in it. I must also admit that most of this I don’t understand, yet. But, it excites me when I do learn something new in Excel. I can’t wait to see how much of this I can implement into my (constantly-evolving) ‘House Budget’ & ‘Family Medical’ worksheets that I have developed over the past few years! I sure hope to see more of these type of newsletters in the future! Thanks!
Thanks for doing this Hui! I appreciate being included.
I like Tom’s tip a lot. I posted about a tool I wrote to automate this at http://yoursumbuddy.com/tables-edit-query-dialog/
EXCELLENT !
Hui, This post is Superb! More over I have always been a fan of Roberto’s work and have learnt a lot from him.
Here are some of my recent contributions
1. Customising markers in a chart – http://www.goodly.co.in/customize-markers-in-a-chart/
2. Charting Hacks to work faster – http://www.goodly.co.in/5-charting-hacks-to-help-you-work-faster/
3. 7 Date formulas to make life easy – http://www.goodly.co.in/date-formulas-in-excel/
4. Customised scrollbar using VBA – http://www.goodly.co.in/customized-scroll-bar-in-excel/
5. Adding Direct Legends – http://www.goodly.co.in/customized-scroll-bar-in-excel/
Hope everyone enjoys!
I like the Excel Ninja Menus.
1. Select a cell or range then move till the 4-way cross appears. Right-Click and drag the selection to another place in the worksheet then, like a ninja, a menu full of skills and throwing stars pops up allowing me to do all kinds of awesomeness.
2. When you click the fill box on a Date and right click and drag it down, a lot of amazing Date options pop up.
I also brand my Excel to remind myself that I’m awesome. In my personal macro workbook I place the following code.
Private Sub Workbook_Open()
Application.Caption = “SuperKrishna’s Awesomeness”
End Sub
My favorite tip goes along with #17. If you try to copy subtotaled data (and in earlier Excel versions filtered data),when you paste it all the data displays instead of just the summarized data.
To get around this, select your summarized data, click on Find and Select tab and then select Go to Special. Click Visible cells Only and click OK. Now paste and you will see that only the summarized data has been copied.
You can also go CTRL+G and then click the Special icon at the bottom of the dialog box.
What a great idea, Chandoo! I’d love to be included in your next edition:) Perhaps a VBA exclusive version?
@Ryan
I will review this concept about 6 months out from the original post and be sure to keep your site in mind
Hui…
That sounds great, Hui:) I just realized I gave credit to Chandoo for the idea and I should have attributed it to you.
Sorry about that!