All articles with 'visualizations' Tag
Sports Dashboards in Excel – A Tutorial

One of my favorite cricket player, the GOD – Sachin Tendulkar has become highest test run scorer. What do I get if Sachin becomes highest scorer, you may ask. In order to celebrate this occasion I have created a cool sports dashboard in excel with some of the top test cricket players’ statistics. And, you […]
Continue »Visualizations of the Week [Oct 10]
![Visualizations of the Week [Oct 10]](https://chandoo.org/wp/wp-content/uploads/2008/10/rocking-news-paper-visualization.jpg)
Every Friday PHD celebrates the art of chart making by showcasing some of the best visualizations around the web. See some of the awesome visualizations featured earlier. World Map Cartogram – Country Area by Population How would the world look like if each country had area proportionate to its population? The above seen cartogram is […]
Continue »Red vs. Blue – 35 Cool Visualizations on 2008 US Presidential Election

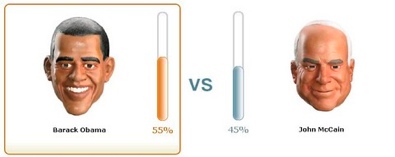
With 2008 US Presidential elections around the corner everyone is busy including chart makers. There are hundreds of excellent visualizations on the presidential election campaign, speeches, issues, predictions that keeping track of what is best can be a tough task. We at PHD have compiled a list of 35 totally awesome visualizations on the 2008 […]
Continue »Visualizing Sex & Love – 10 Infographics You Must See

Dont think of me as a perverted spreadsheet user, I like visualizations in any form or shape. There is so much data even about human relationships like love and sex. This article shows 10 of the most visually beautiful and insightful of the infographics on sex and love. Click on the titles above images to […]
Continue »

